Organizing Figma Artboards as Screen Flows
Making the file layout the flow, so nobody asks how the screens connect.
Most designers do the IA work properly. A sitemap, a flow chart, sometimes a Miro board. The structure holds up. Then it goes into a file nobody opens again.
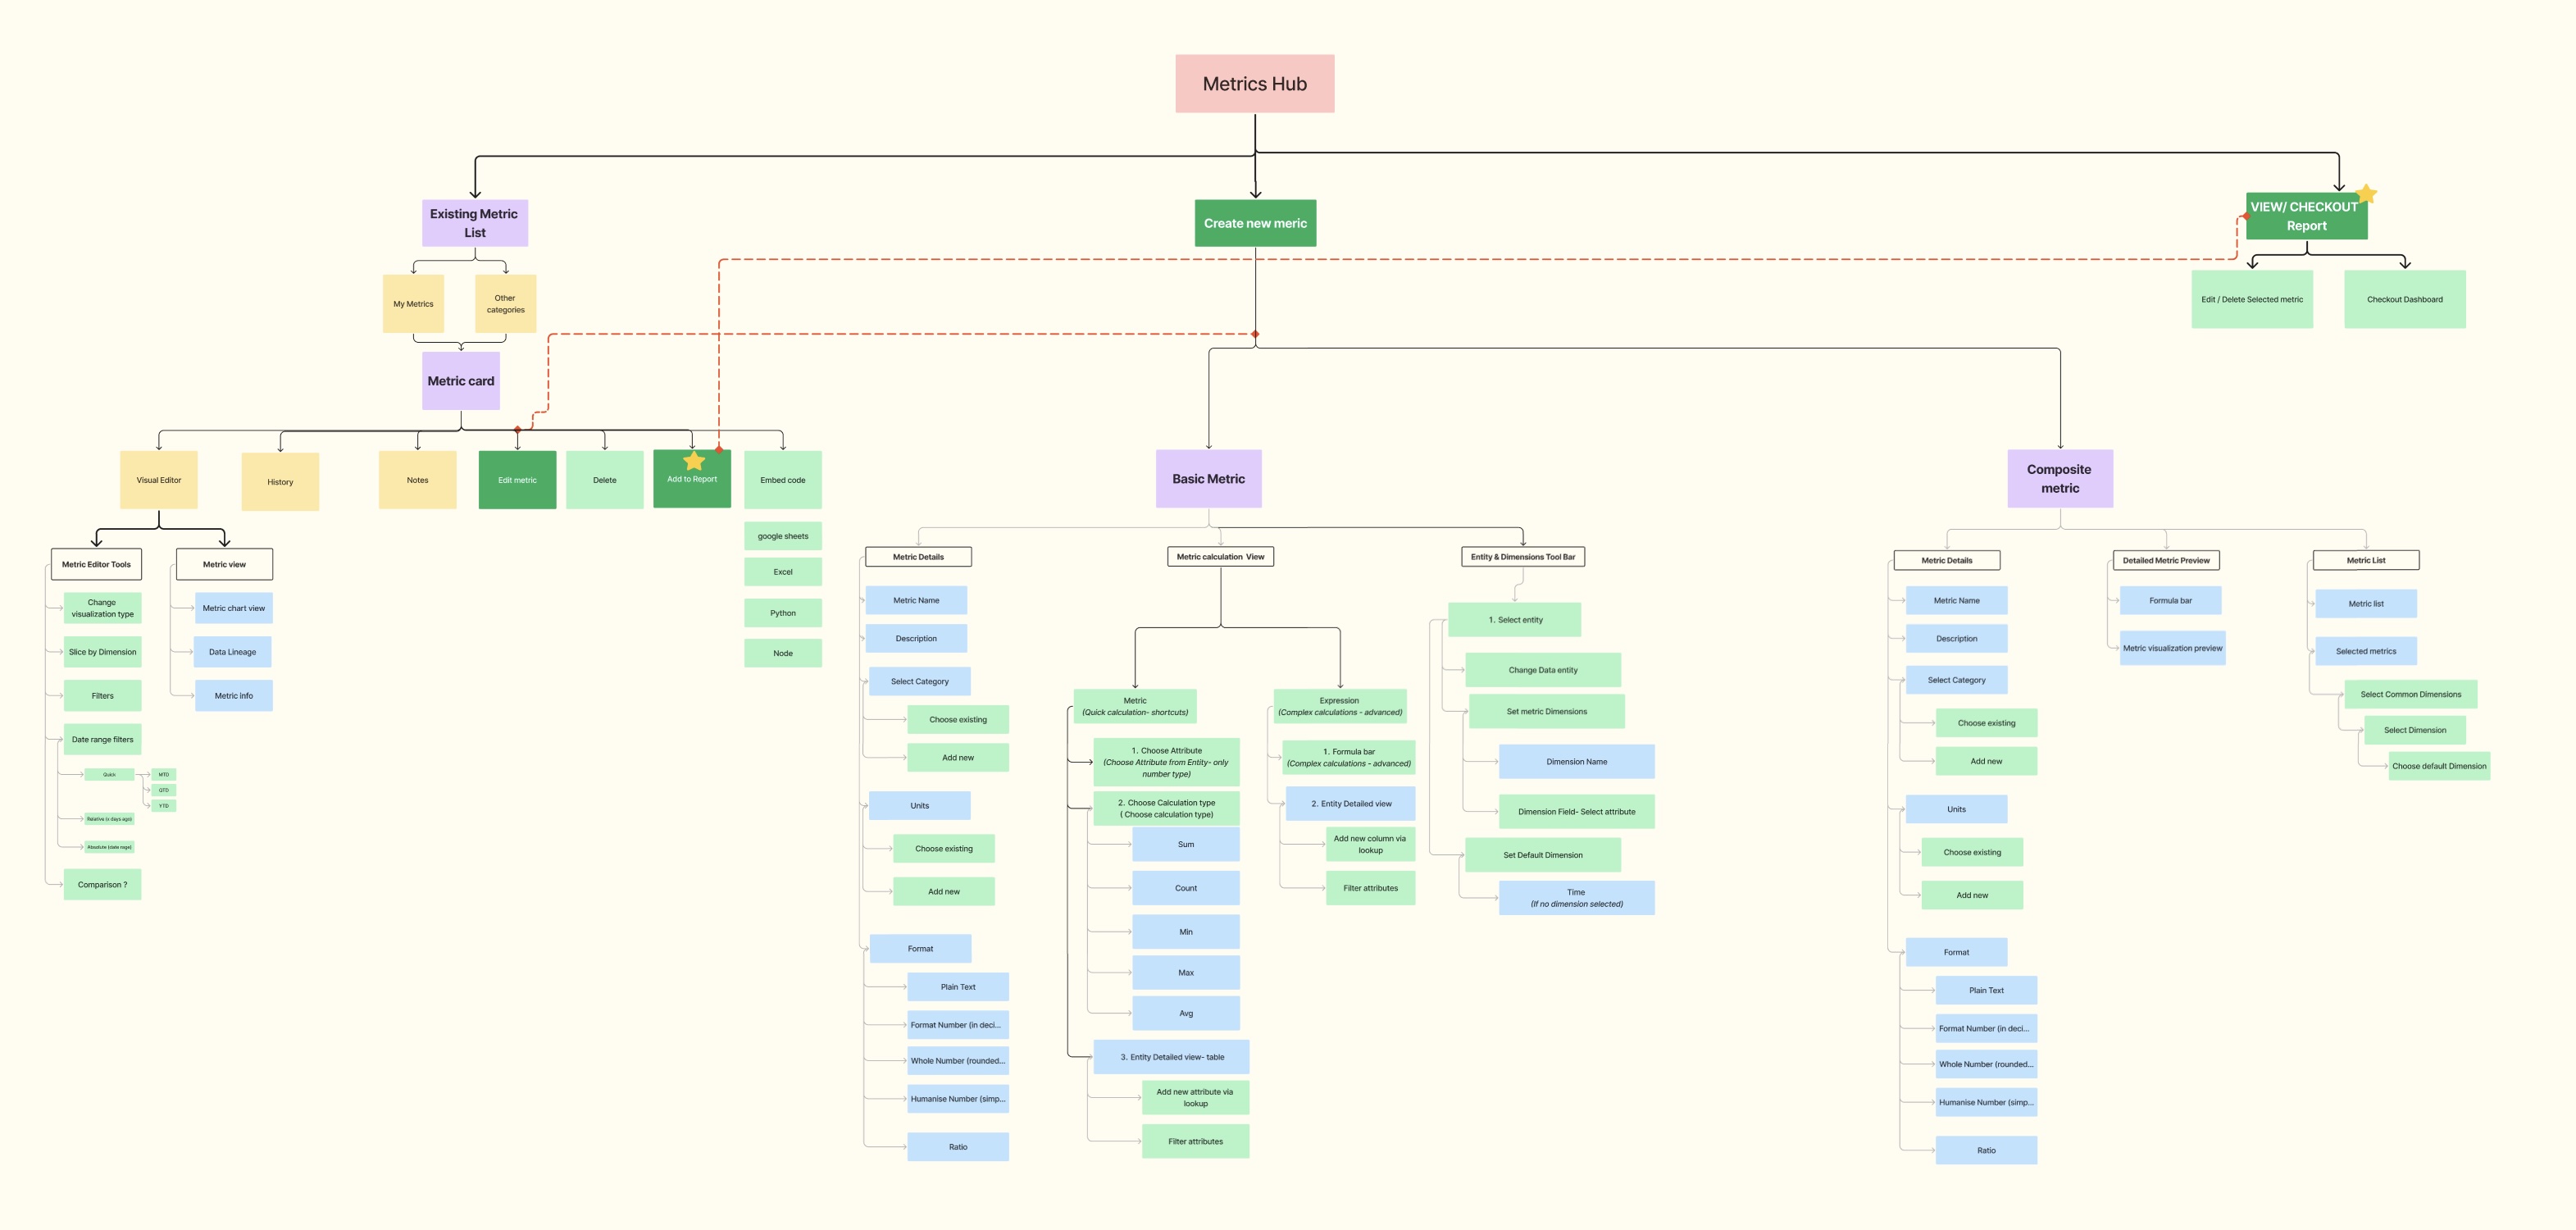
What reaches engineering is fifty artboards on a Figma canvas with no stated relationship between any of them. Which screen comes first? Where does this fork? The IA answered all of that, in a different file, and the answers didn’t travel.
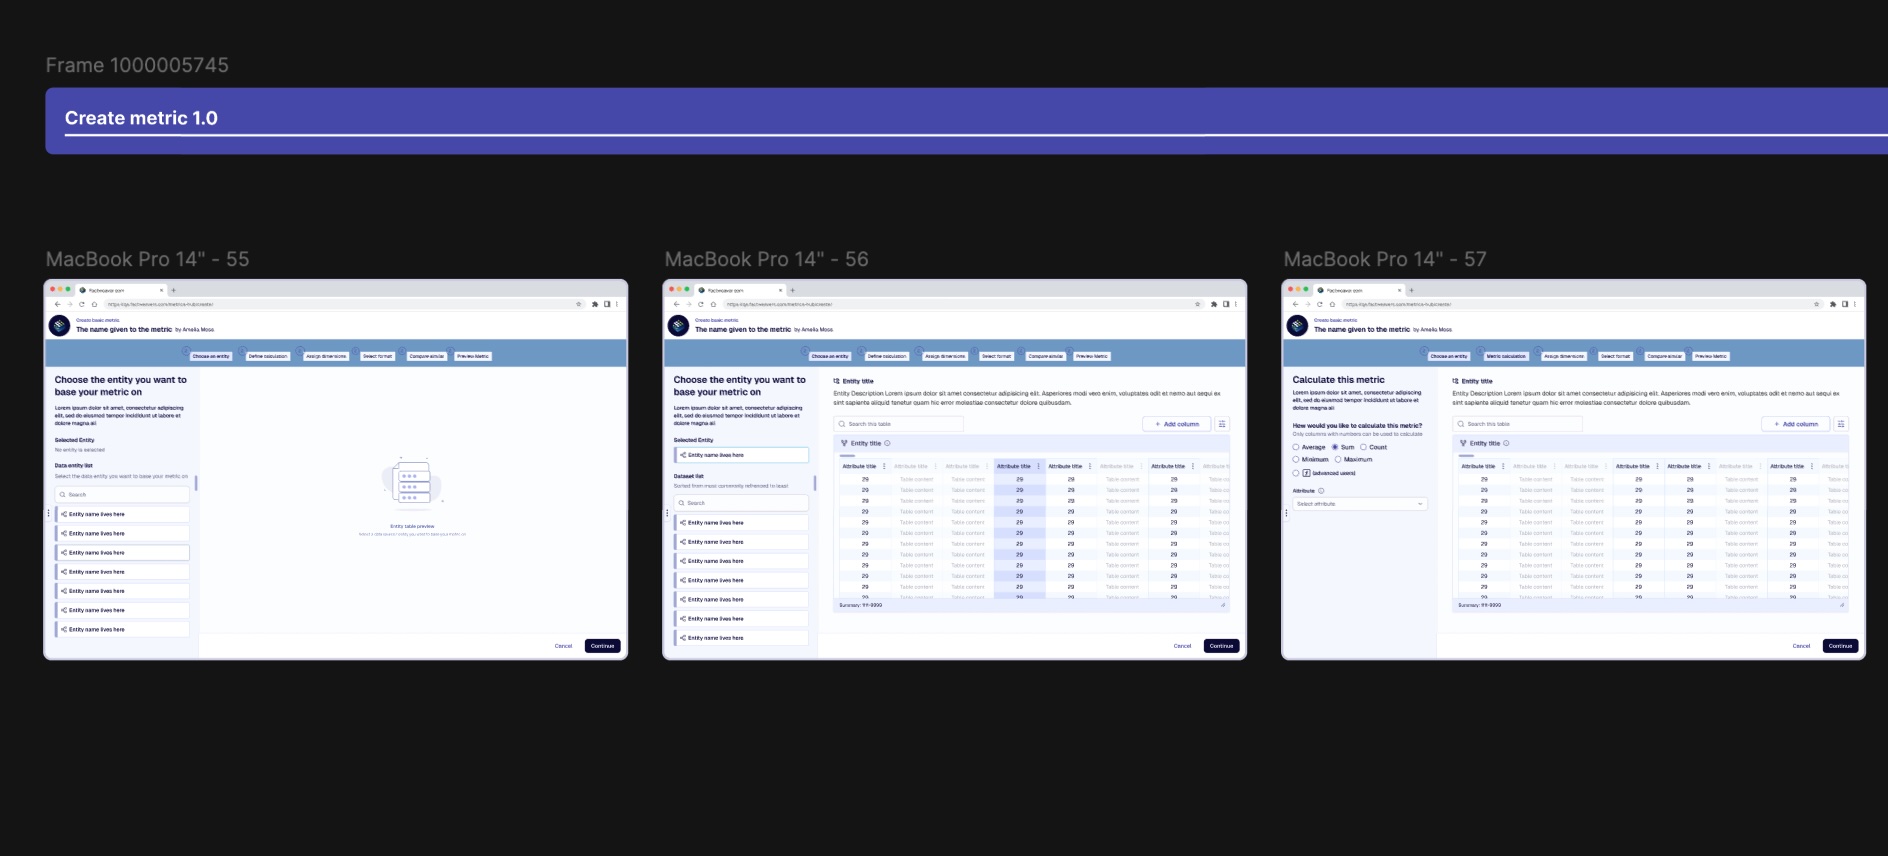
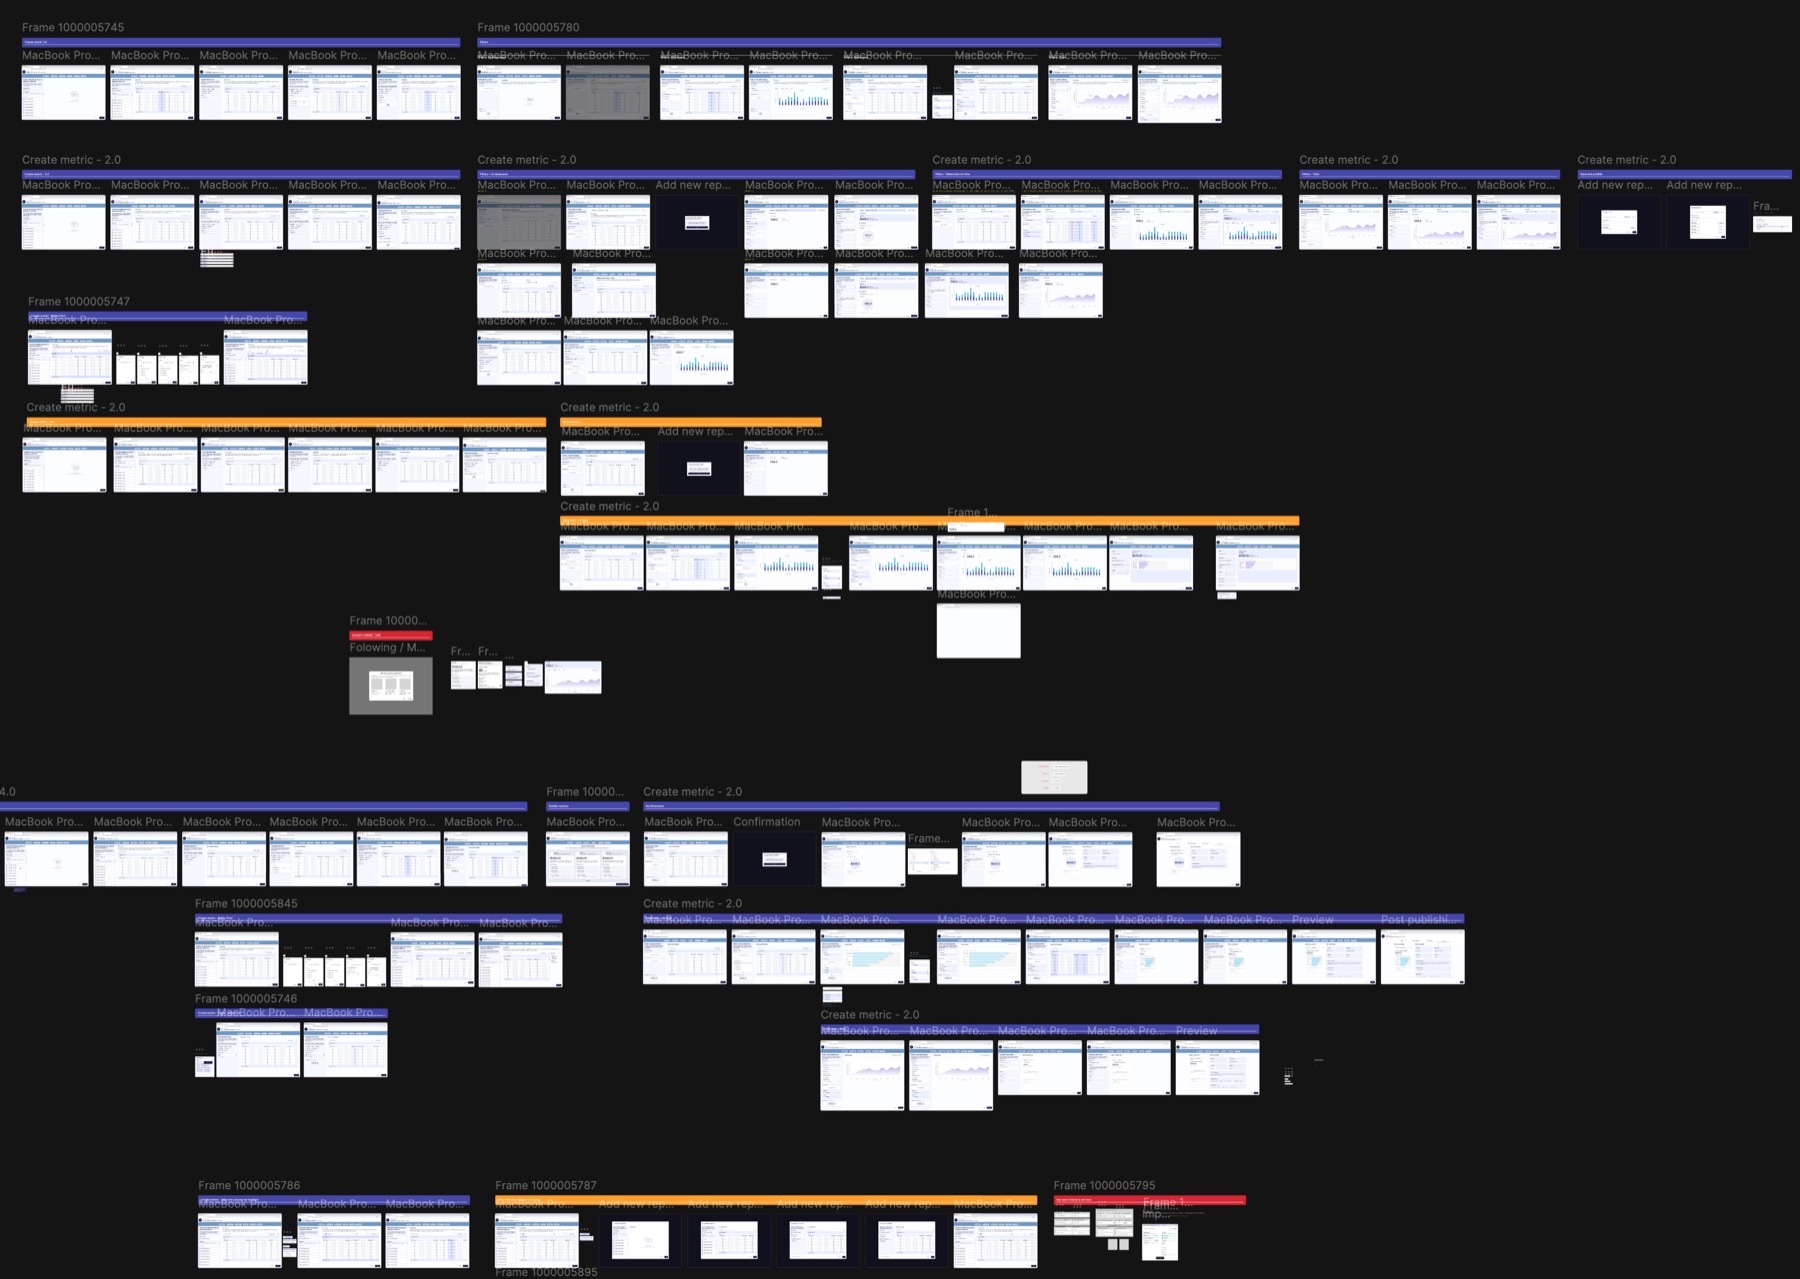
On a consumer app you can get away with this. The flows are mostly linear, so a developer can work out the order from the screens themselves. Enterprise apps don’t give you that. You’re dealing with role-based access, conditional steps, modules that talk to each other, and edge cases that multiply with every feature. Fifty screens in a grid tells you nothing about the relationships between them, and the relationships are the part that’s hard to build.
So I stopped keeping the 2 artifacts apart. The file layout is the flow now. Open the file, see how everything connects.
Sections as structure
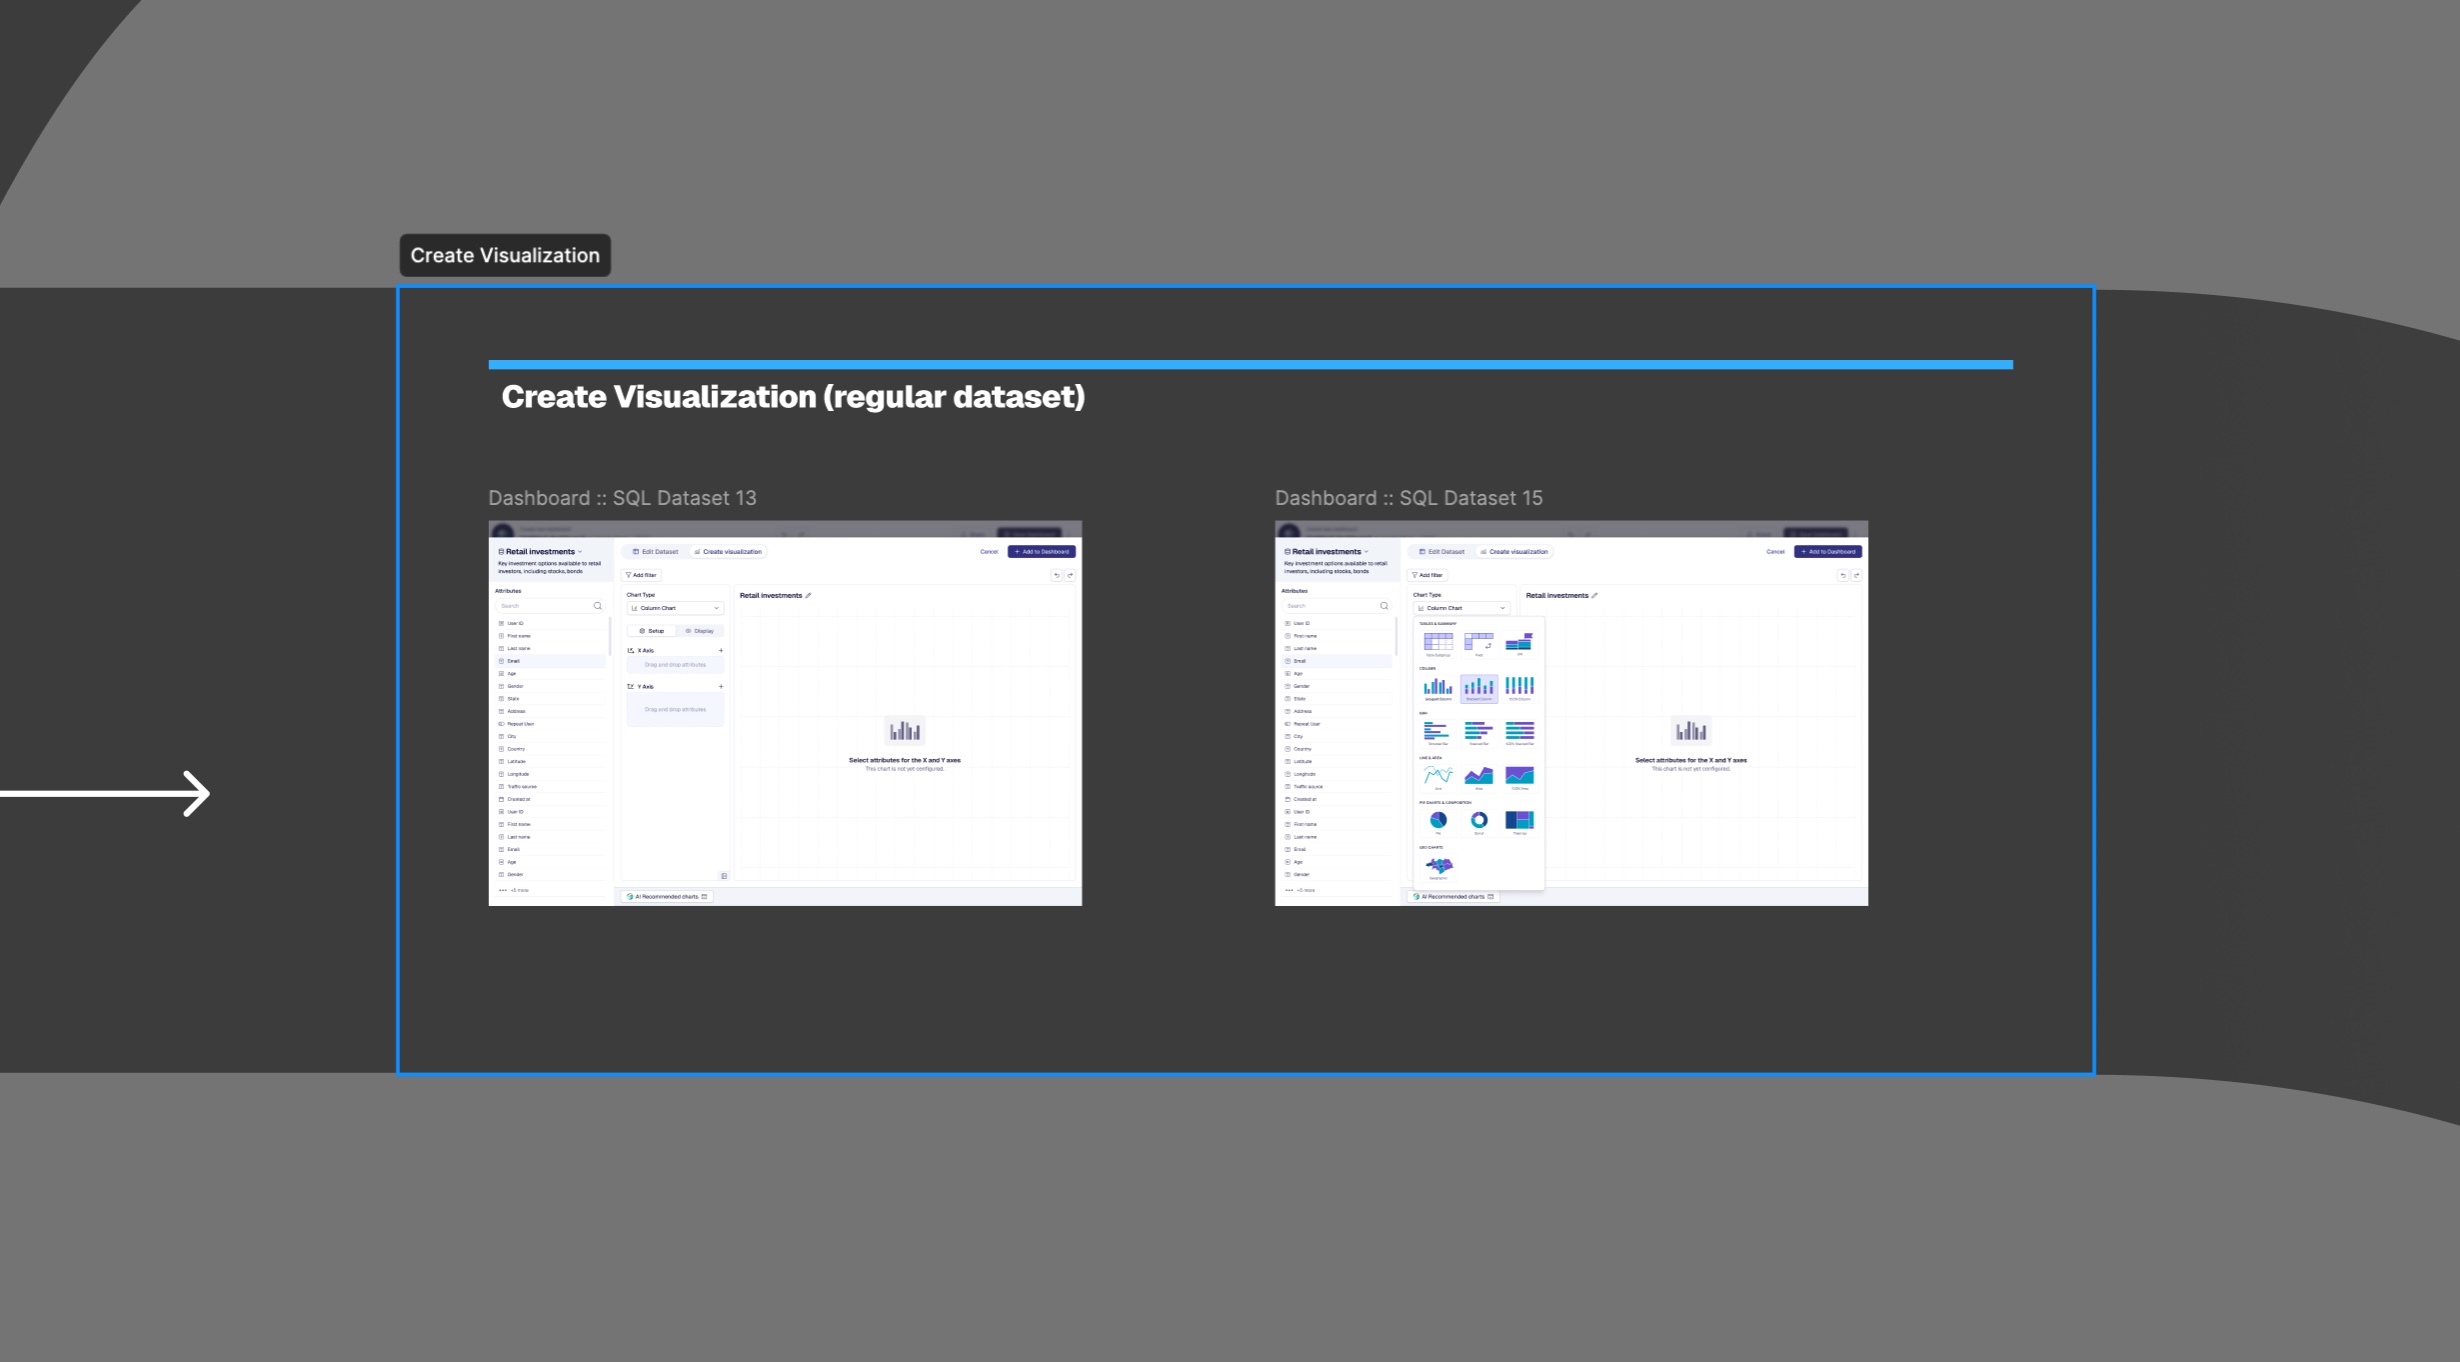
Figma sections are the foundation. Each section is one distinct chunk of the flow: a step, a decision point, a module. The actual screens live inside it.
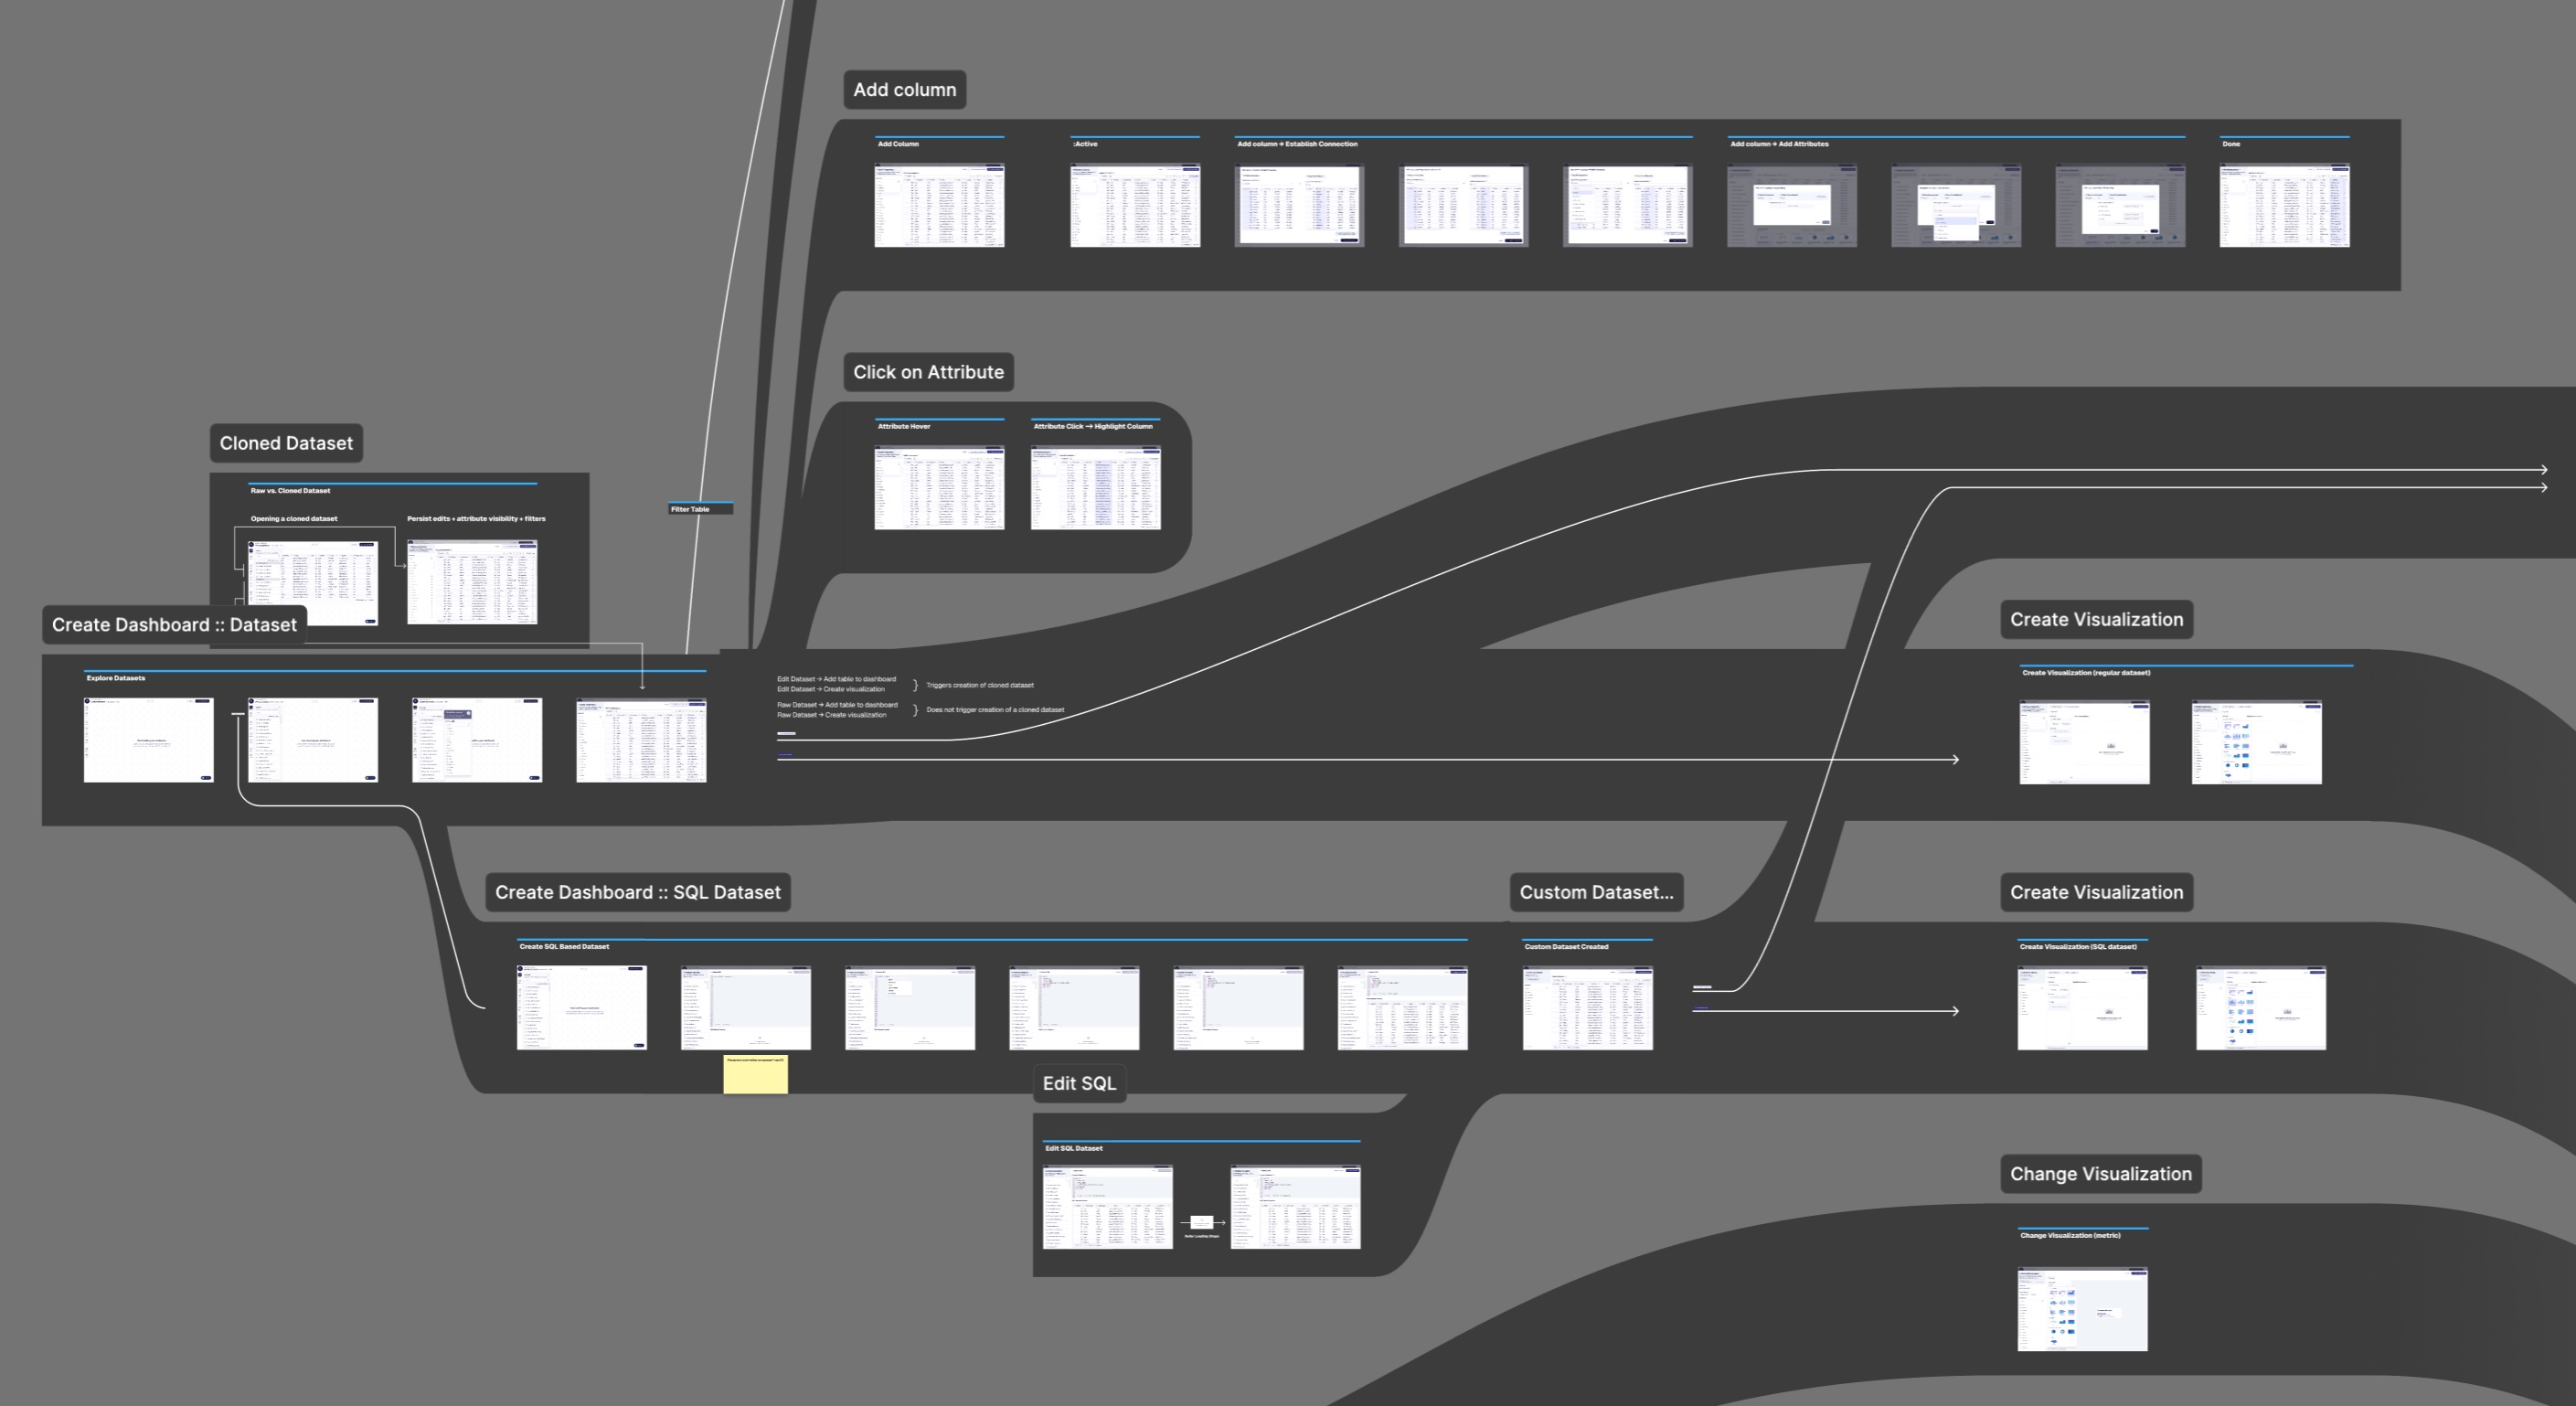
The canvas becomes a map. Zoom out and you see the full flow, zoom in and you’re looking at the UI for that one part of it.
The primary flow
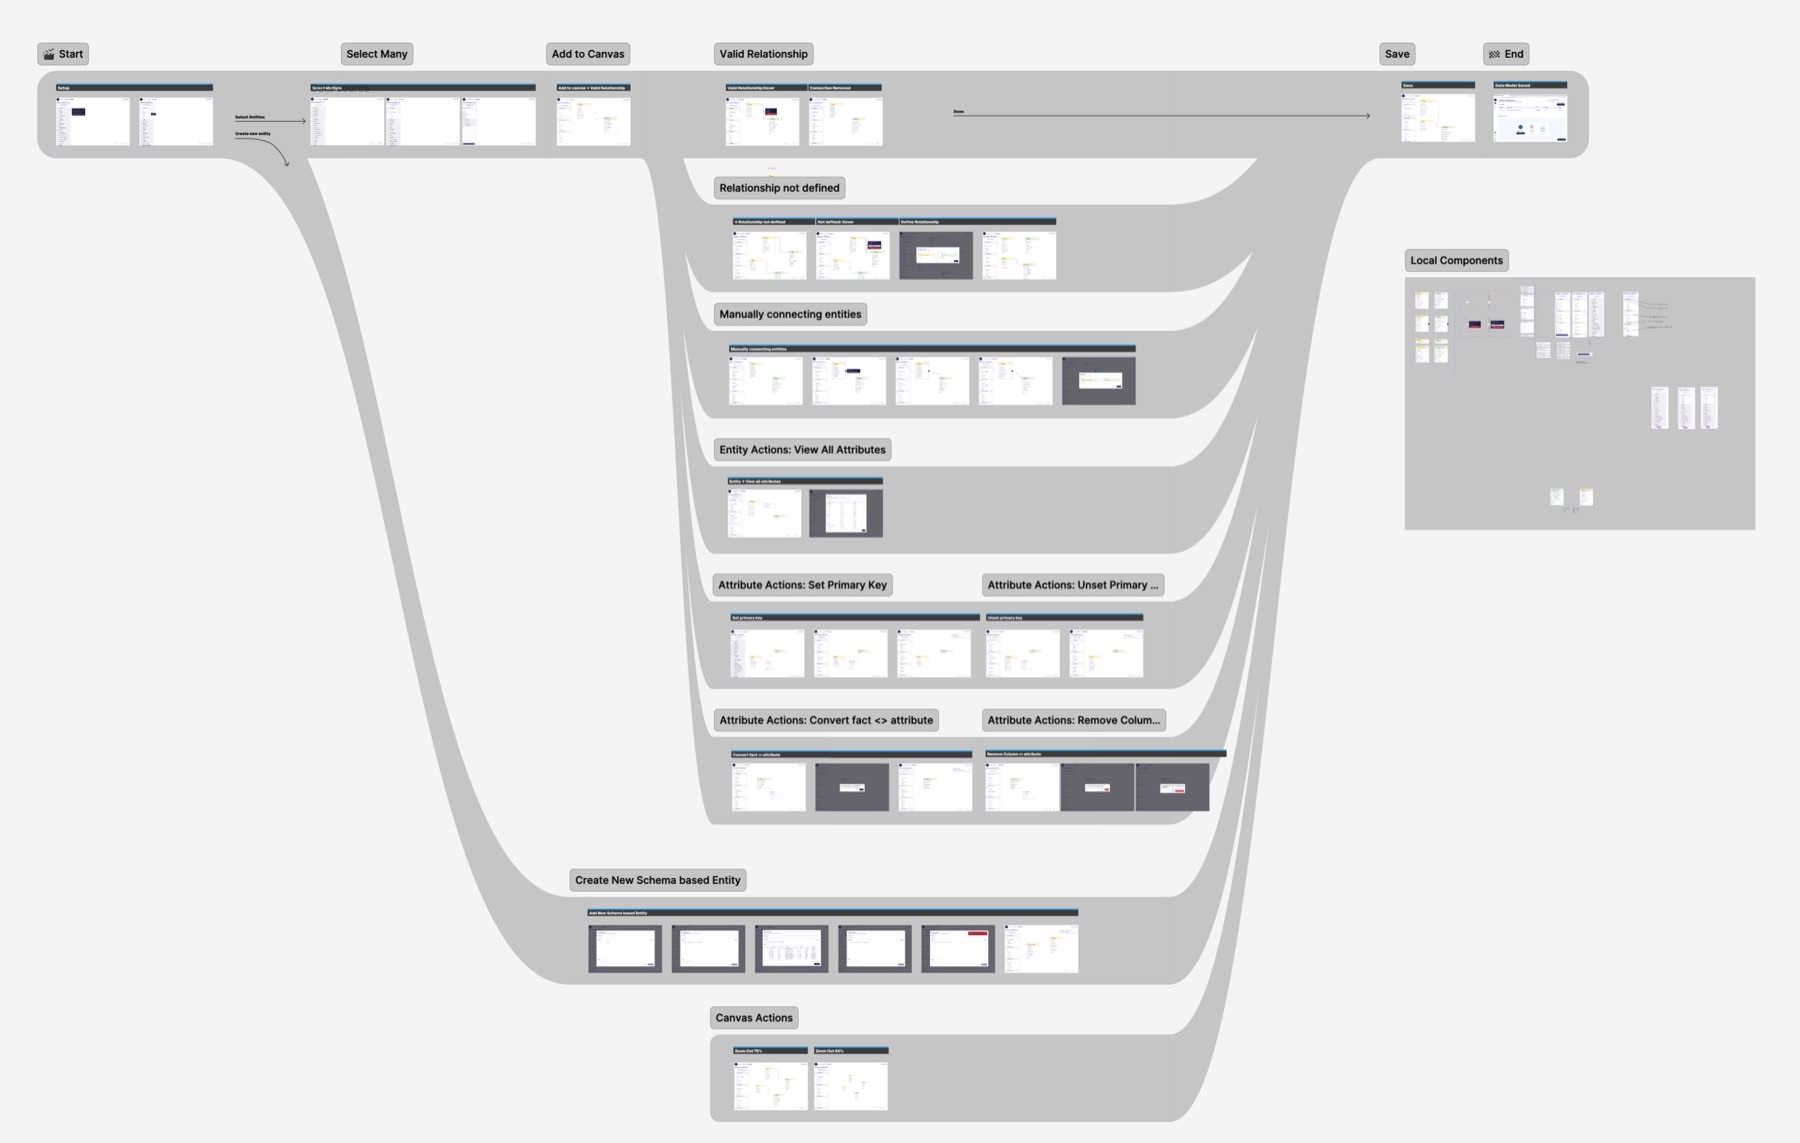
The primary flow runs horizontally across the canvas, left to right. Start point on the left, final screen on the right. Every section in between is a step in the journey.
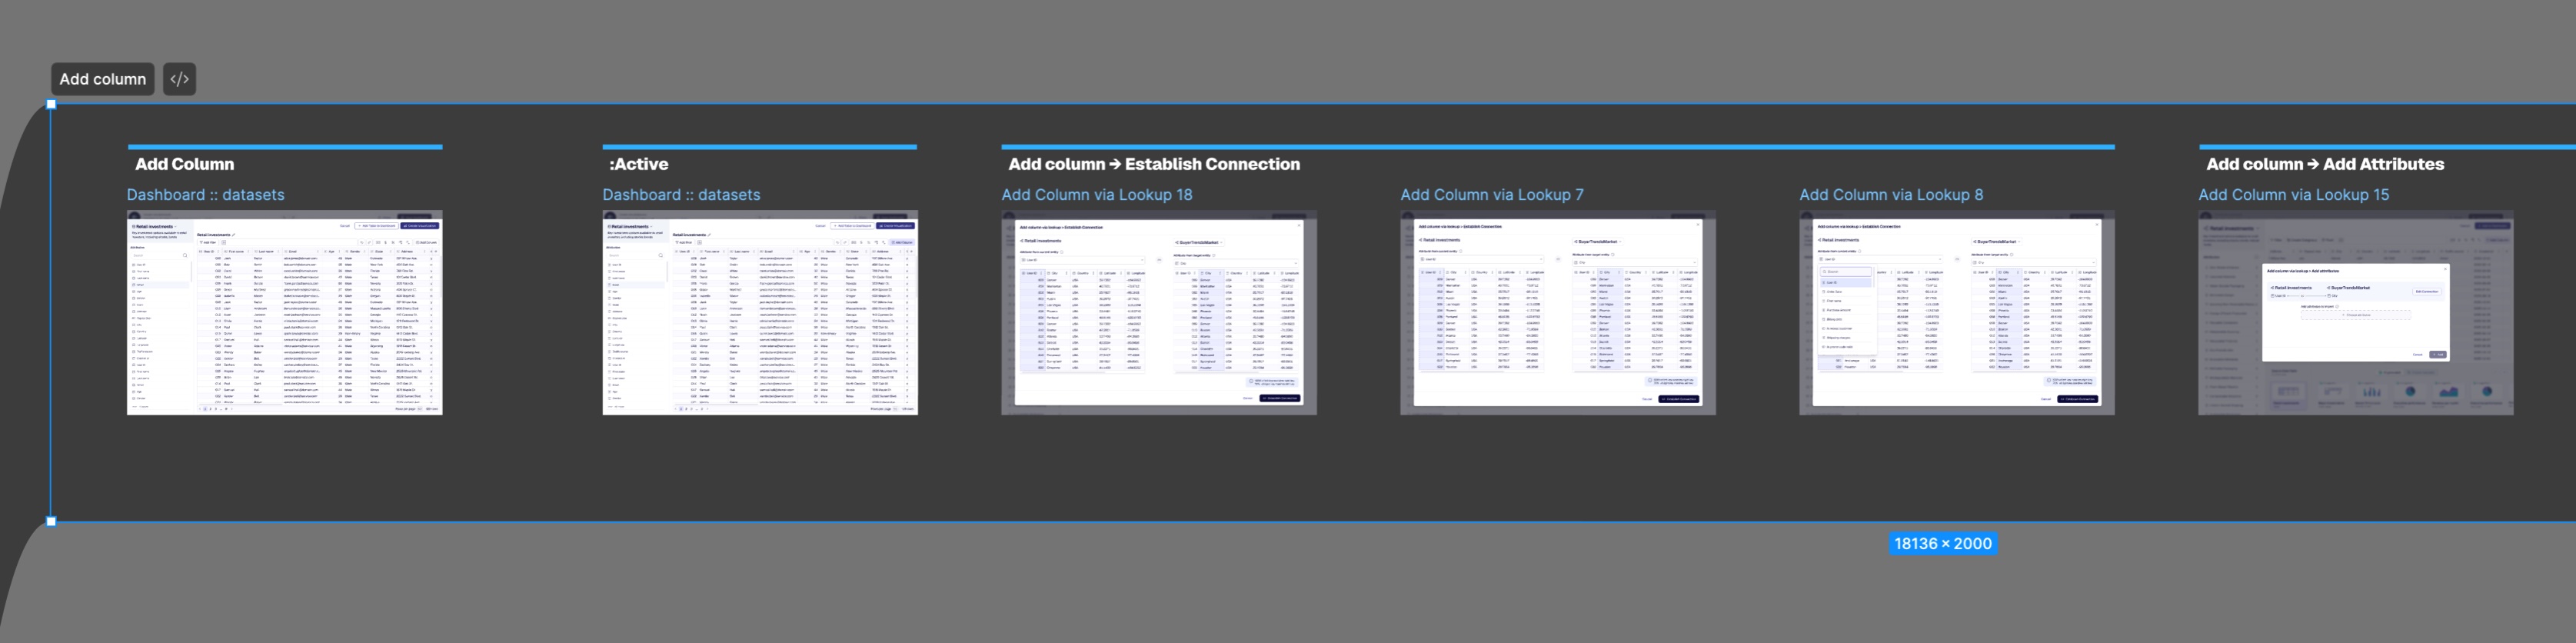
This sounds trivial and it isn’t. When screens are scattered with no spatial logic, every conversation about the flow opens with “wait, which screen are we talking about?” When the layout is the flow, nobody asks that.
Handling forks
When a flow splits, say the user can take path A or path B, each path gets its own section. Those sections sit above and below each other, branching off from the decision point.
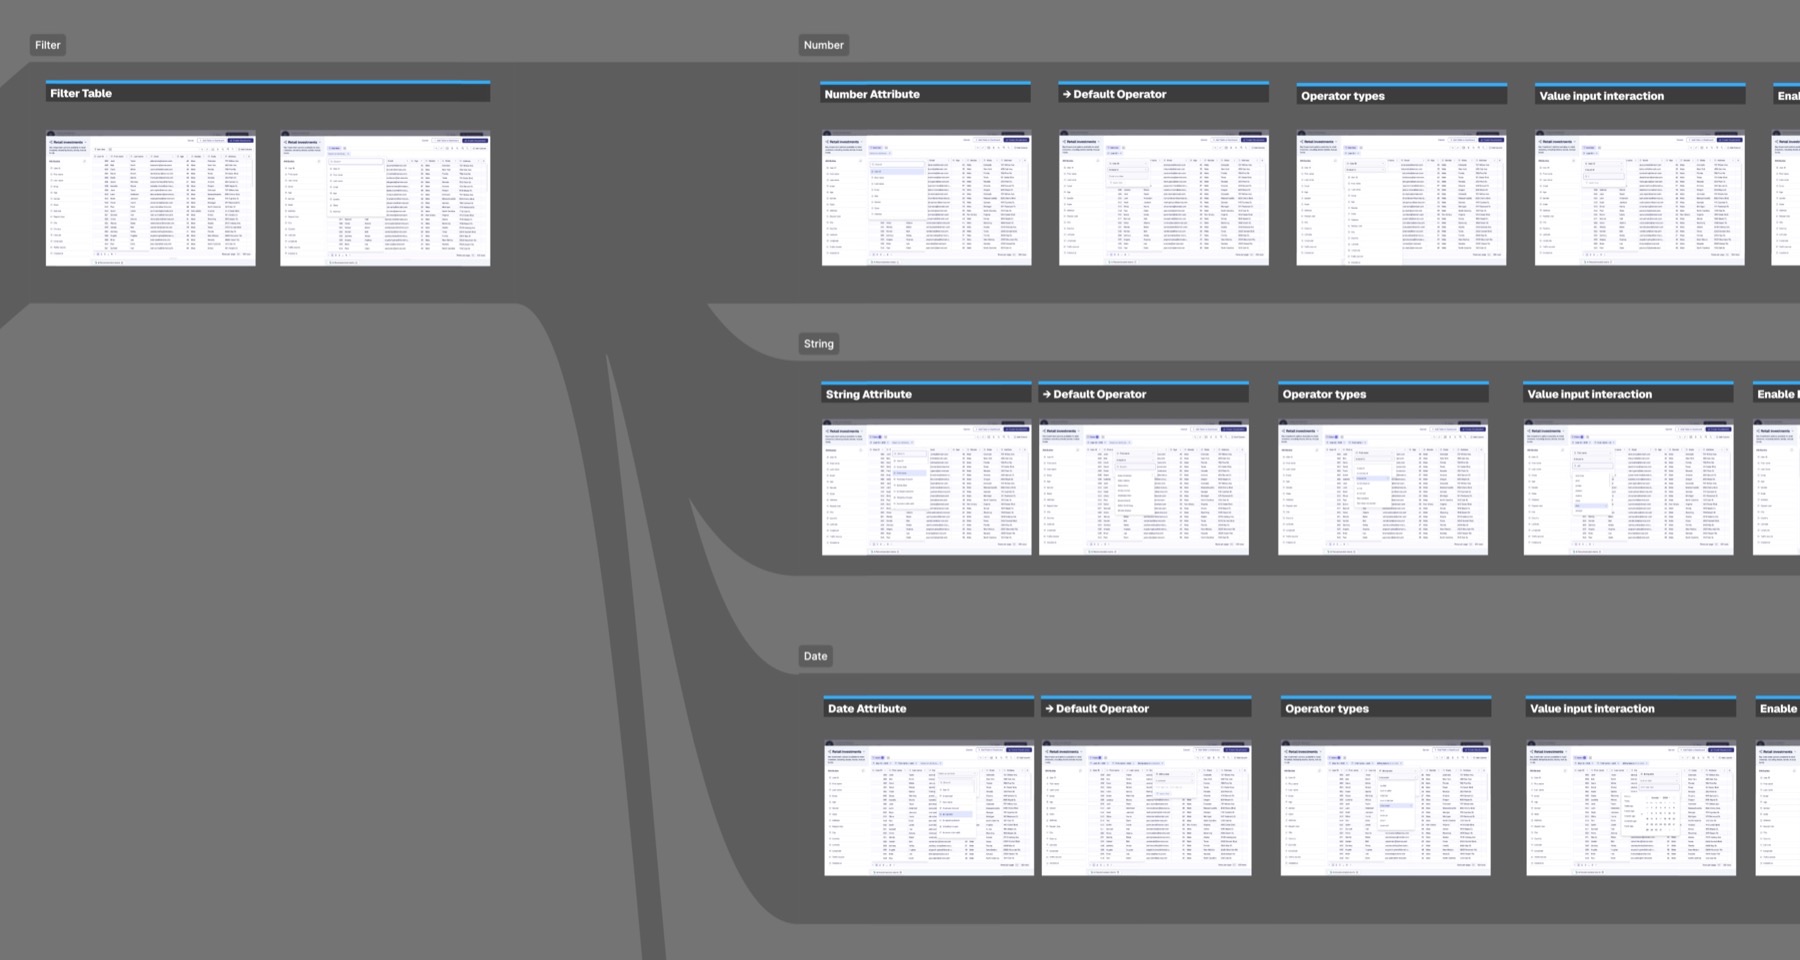
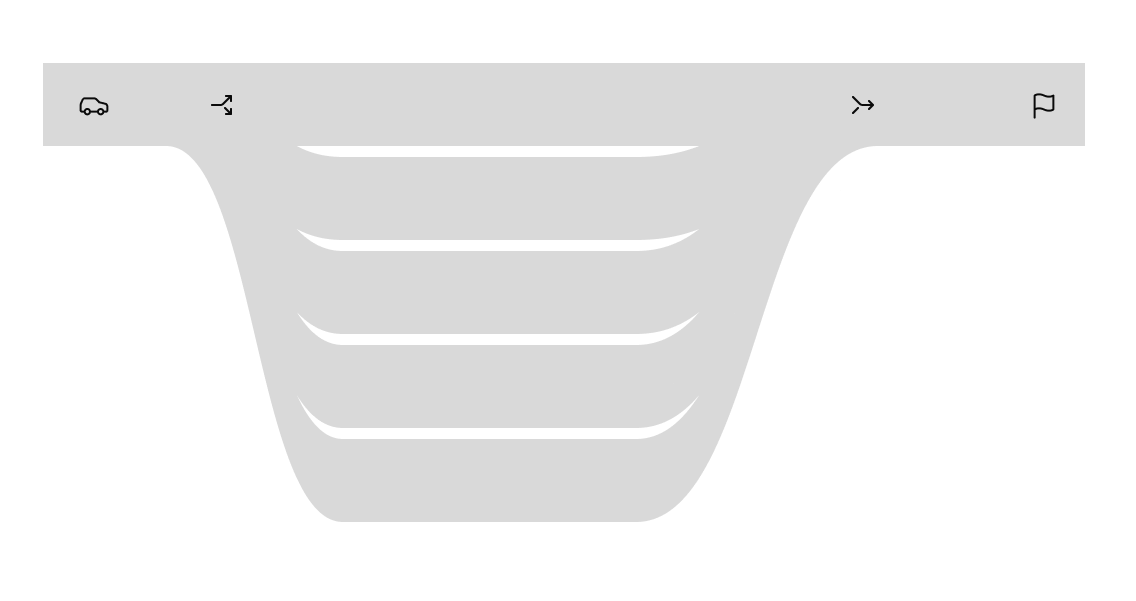
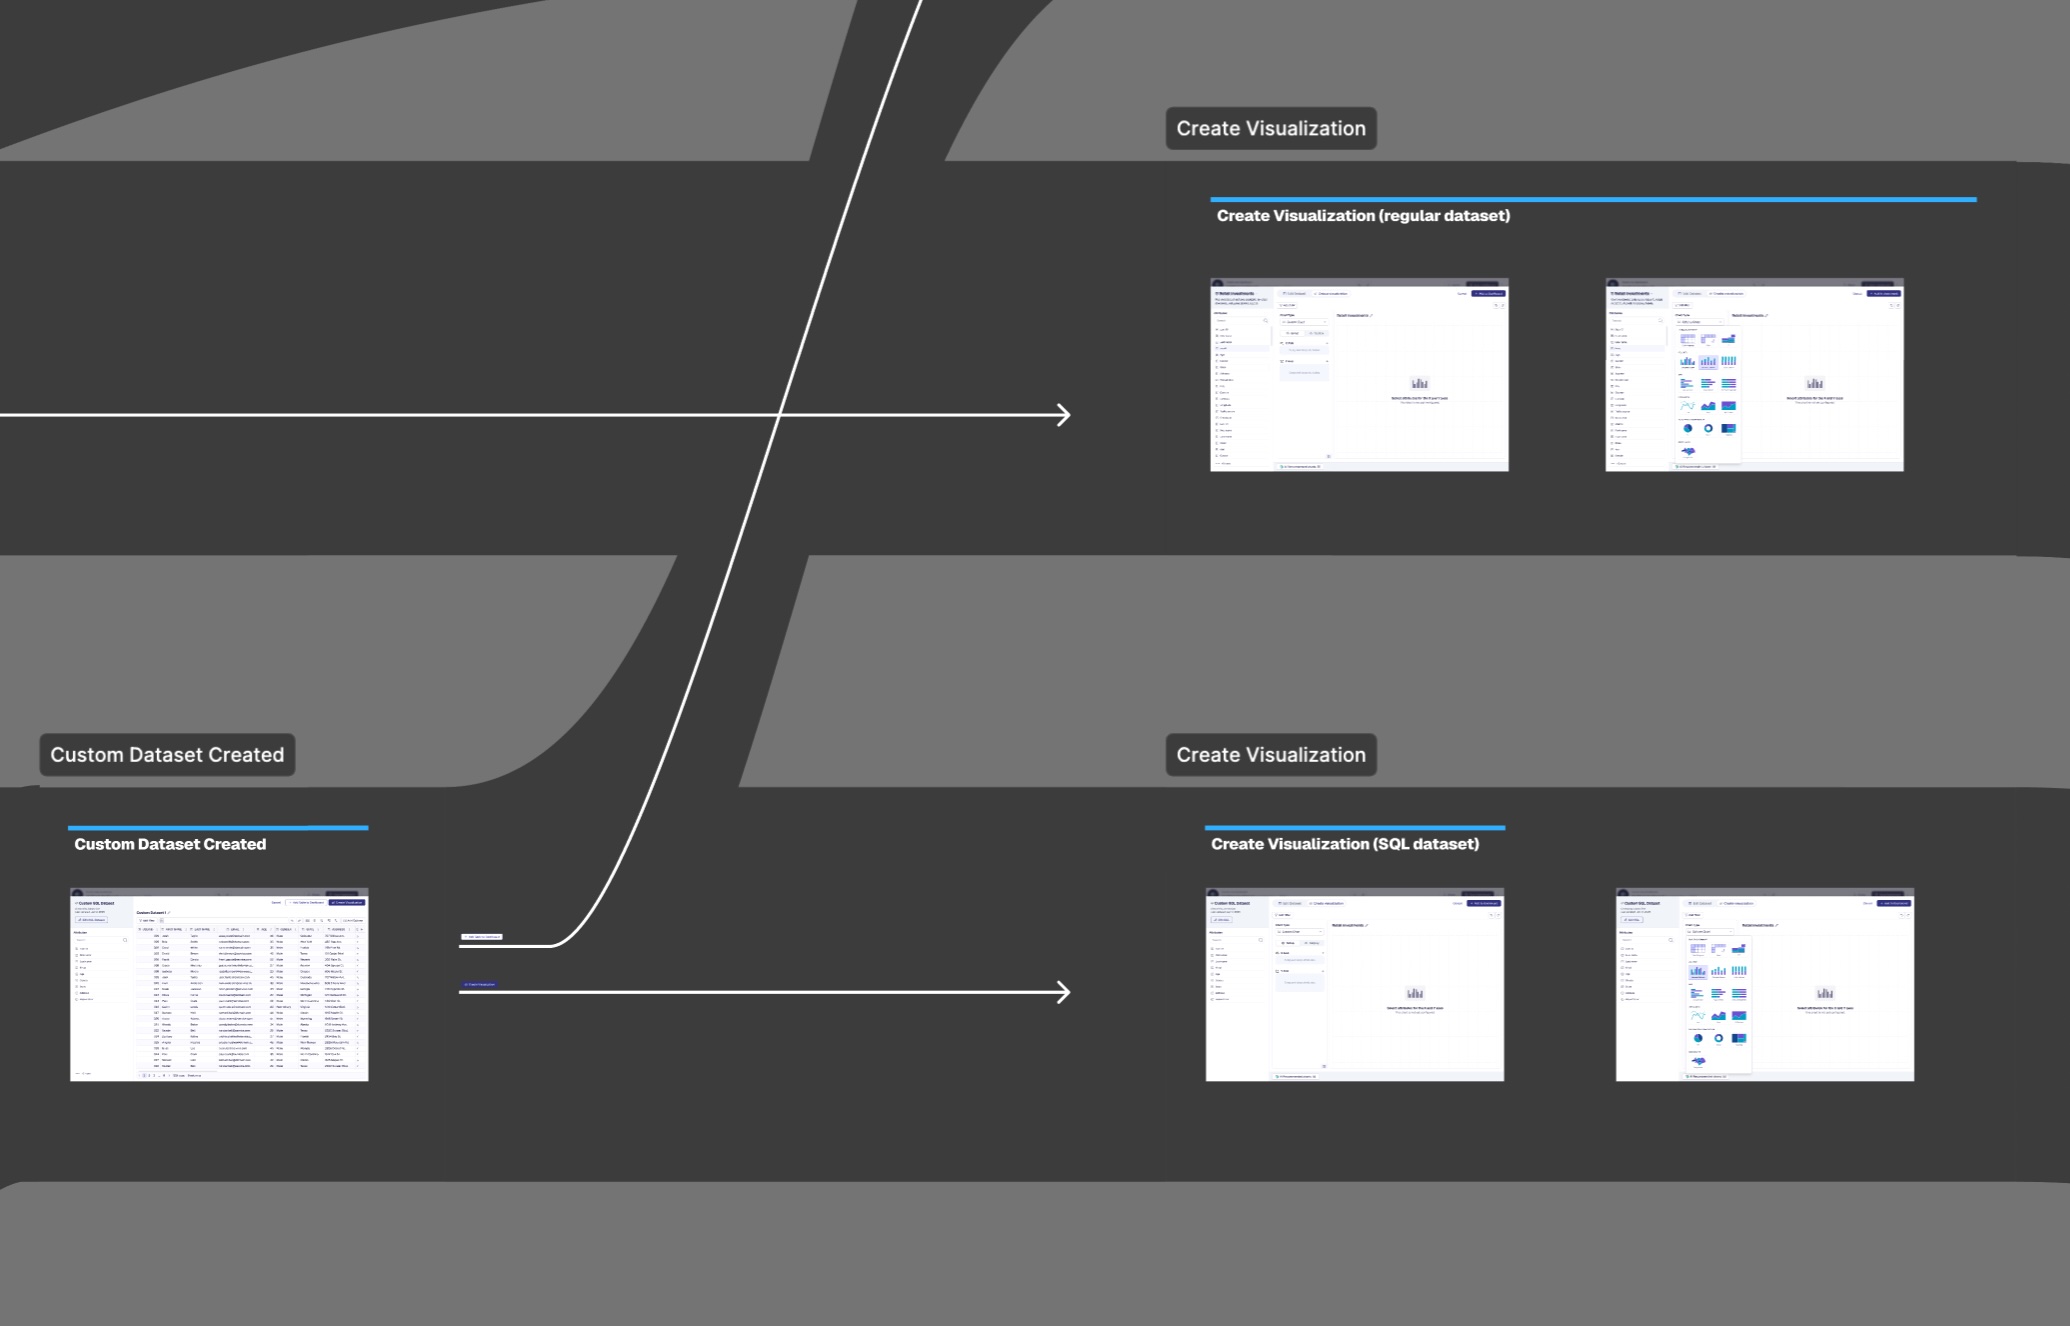
To show how sections connect, I draw vectors shaped like a sankey diagram: lines that flow out of one section and fan into the next ones, thick where a lot goes through. It makes it obvious where paths split and where they come back together.
I use a Figma plugin called Sankey Connect to do this fast. Drawing the connections by hand is tedious and fragile. The plugin handles the routing and gives you clean, readable lines.
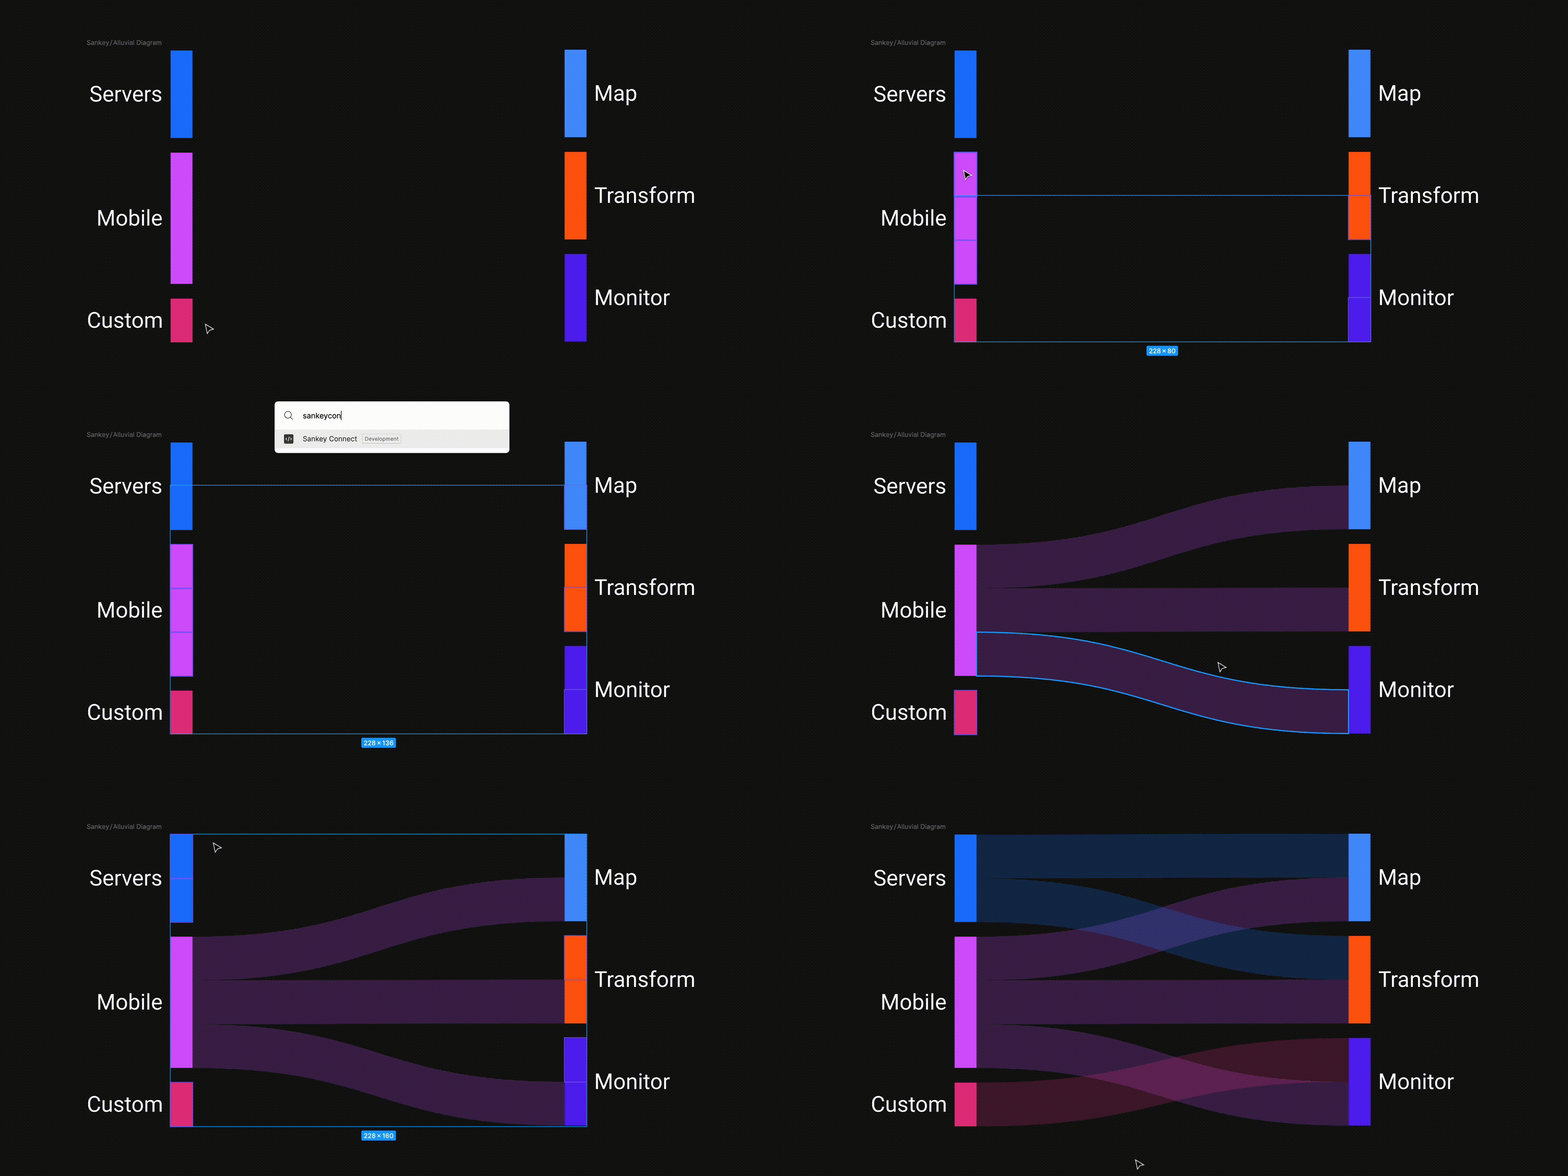
Once the vectors are drawn, I send those layers to the back of the canvas and lock them, so they don’t interfere with selection or editing. You can click screens, drag frames, do your normal design work. The connections stay put, visible but out of the way.
Where flows intersect
In enterprise apps, flows aren’t linear. They branch, merge, and share steps, and the section-based layout handles that without any extra work.
On Factweavers, users can create either a simple metric or a composite metric. Two fundamentally different paths, so they live in two separate sections. But at certain points the next step is identical regardless of which path you took. The sections intersect, the vectors from both paths converge into the same section, and the flow continues as one.
Zoom out and you can trace every possible route from start to finish. The connections make it clear where paths split, where they merge, and where the user ends up.
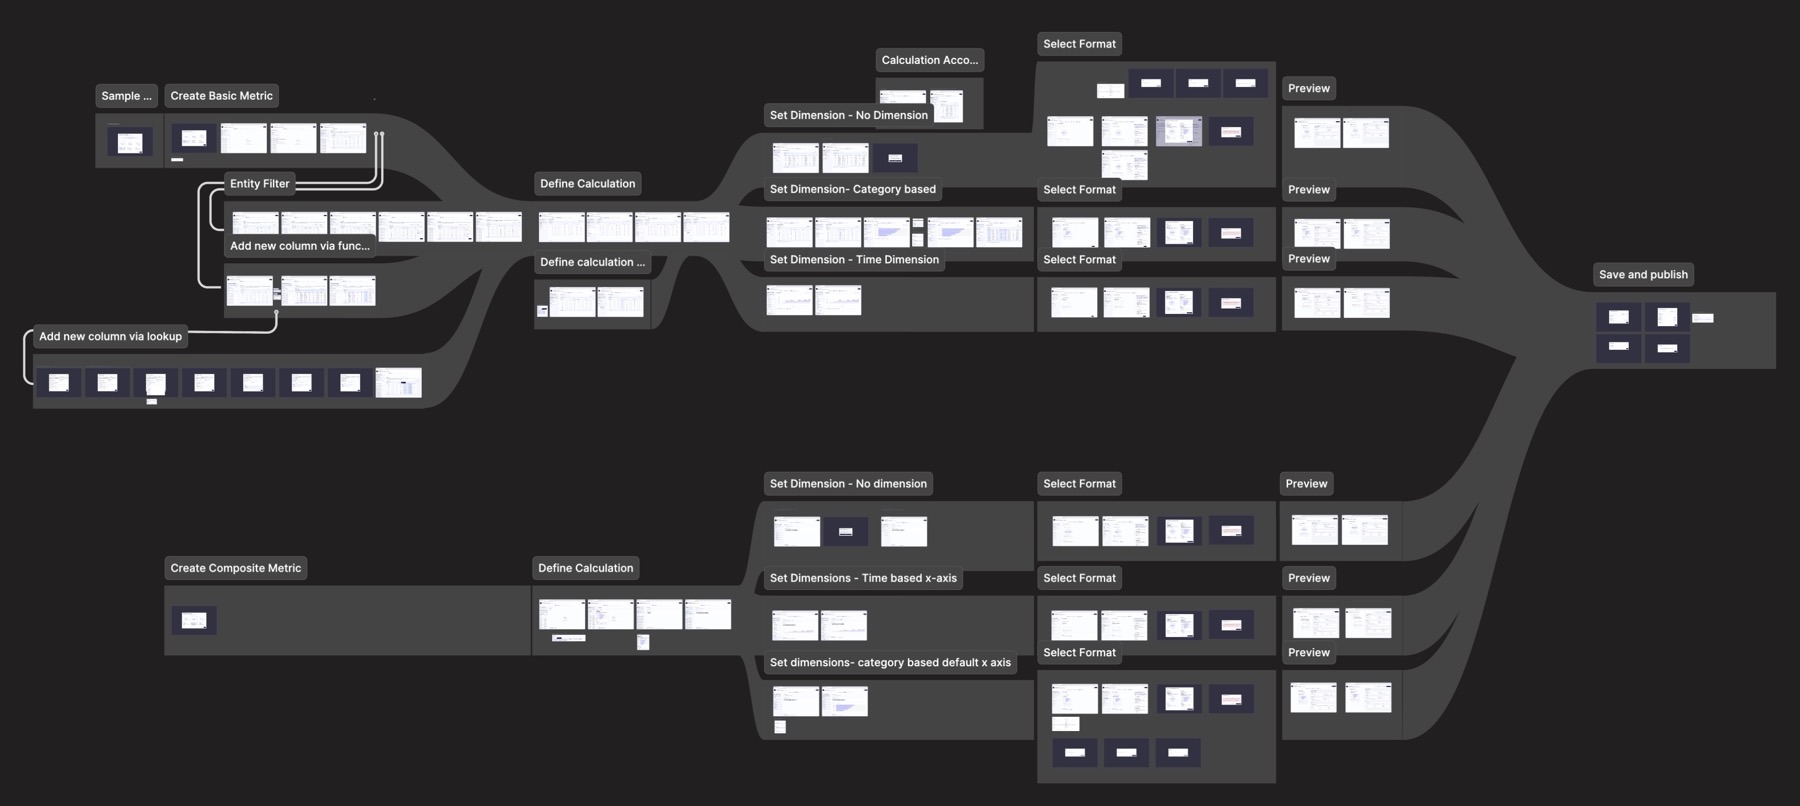
Sections connected by sankey-style vectors turn the file into a living diagram. A developer reads it for the flow, a PM reads it for scope, and QA reads it for the paths they have to test, all without anyone calling a meeting to explain it.
The setup
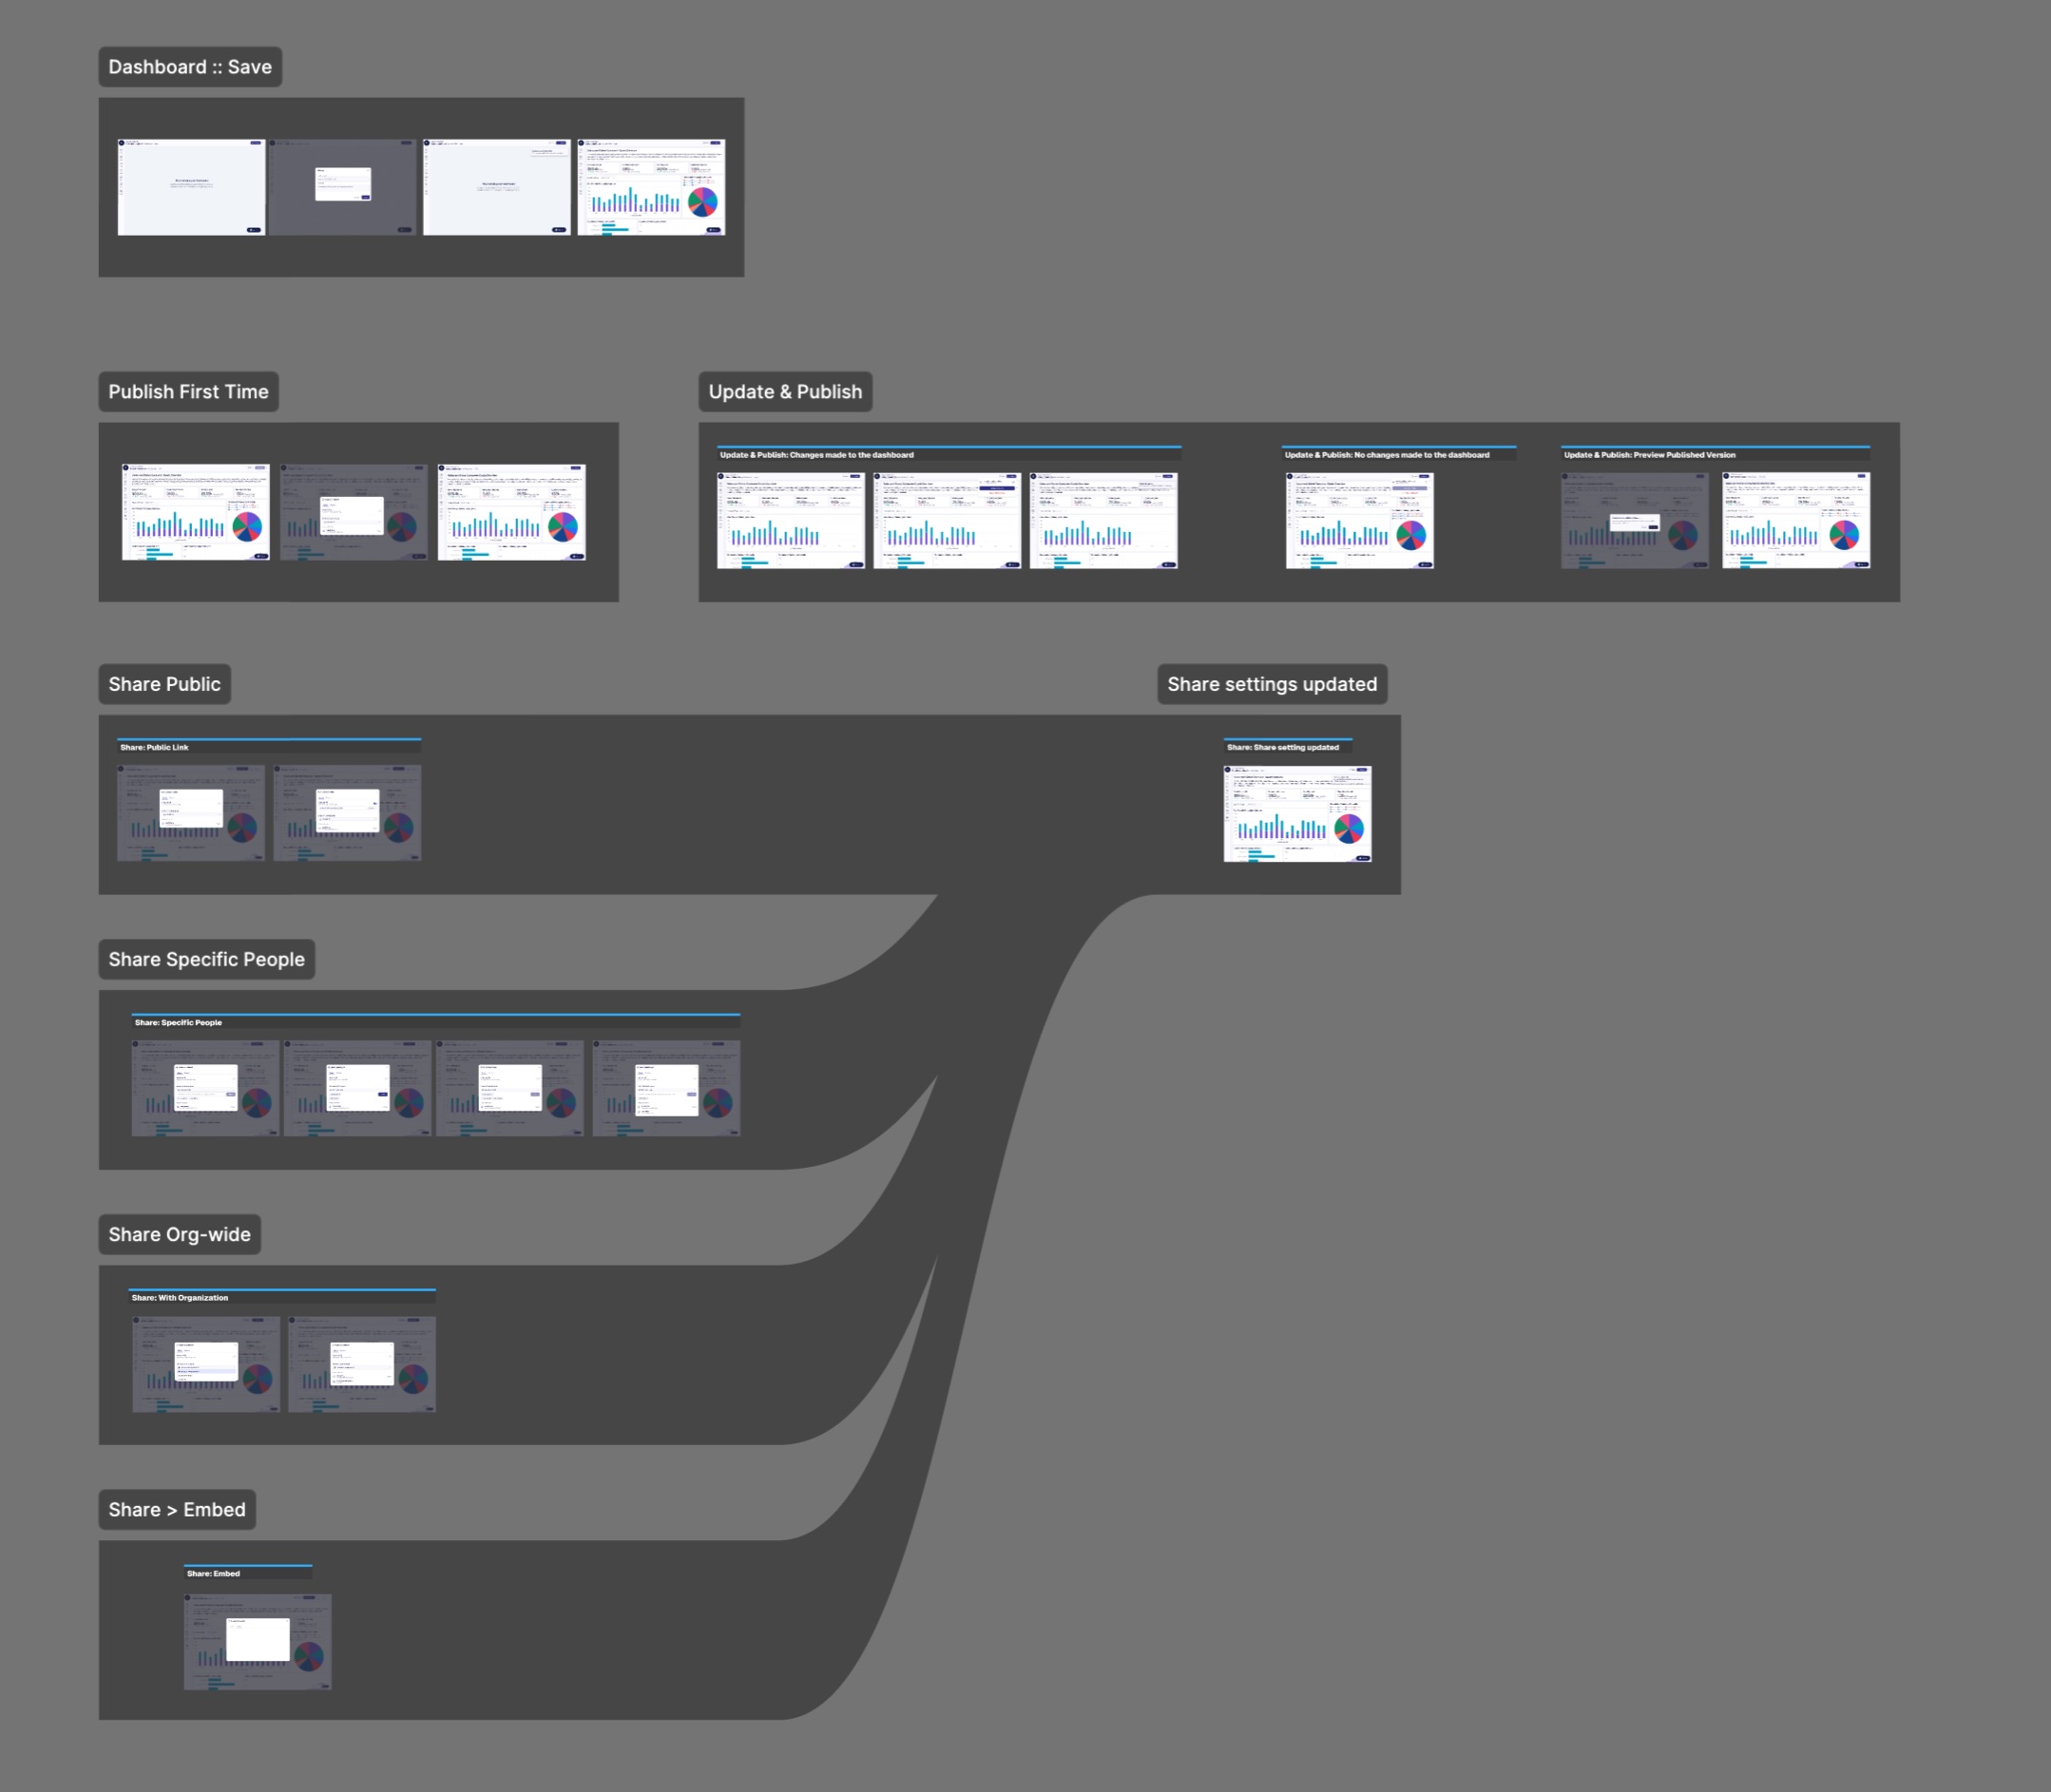
Start with the IA in a separate file. Sitemaps, taxonomies, navigation structure. Get that right before touching Figma. Then create sections for each major step or module, and lay the primary flow out horizontally, left to right.
When the flow forks, branch vertically. Separate paths get their own sections, stacked above or below. Use Sankey Connect to draw the connections, then send the vector layers to the back and lock them. When flows converge on a common step, route both sets of vectors into the shared section. All paths end at the final screen on the right.
The file is the documentation
The IA still lives in its own file. That’s where the structural thinking happens, and it should stay there. What changed is that the Figma file now reflects it instead of ignoring it.
When I hand off a file structured this way, I rarely get asked how the screens connect. People find it on the canvas before they think to ask.