I Fixed My Slow Mac and Found an Apple Bug
An afternoon with an LLM, one wrong theory, and a resource leak in an Apple daemon.
The standard warning about LLMs is that they make things up, so the standard defence is to check the facts. I checked the facts. Every log line in the theory that cost me an hour was real, and I could open each one.
The theory was still wrong. It explained 45% CPU using an event that fired twice in 10 minutes, and neither of us put those 2 numbers next to each other for about an hour. That’s the failure checking facts doesn’t catch: a plausible story assembled entirely out of true details. What caught it was asking for a measurement instead of an explanation, and that turned up a resource leak in an Apple daemon.
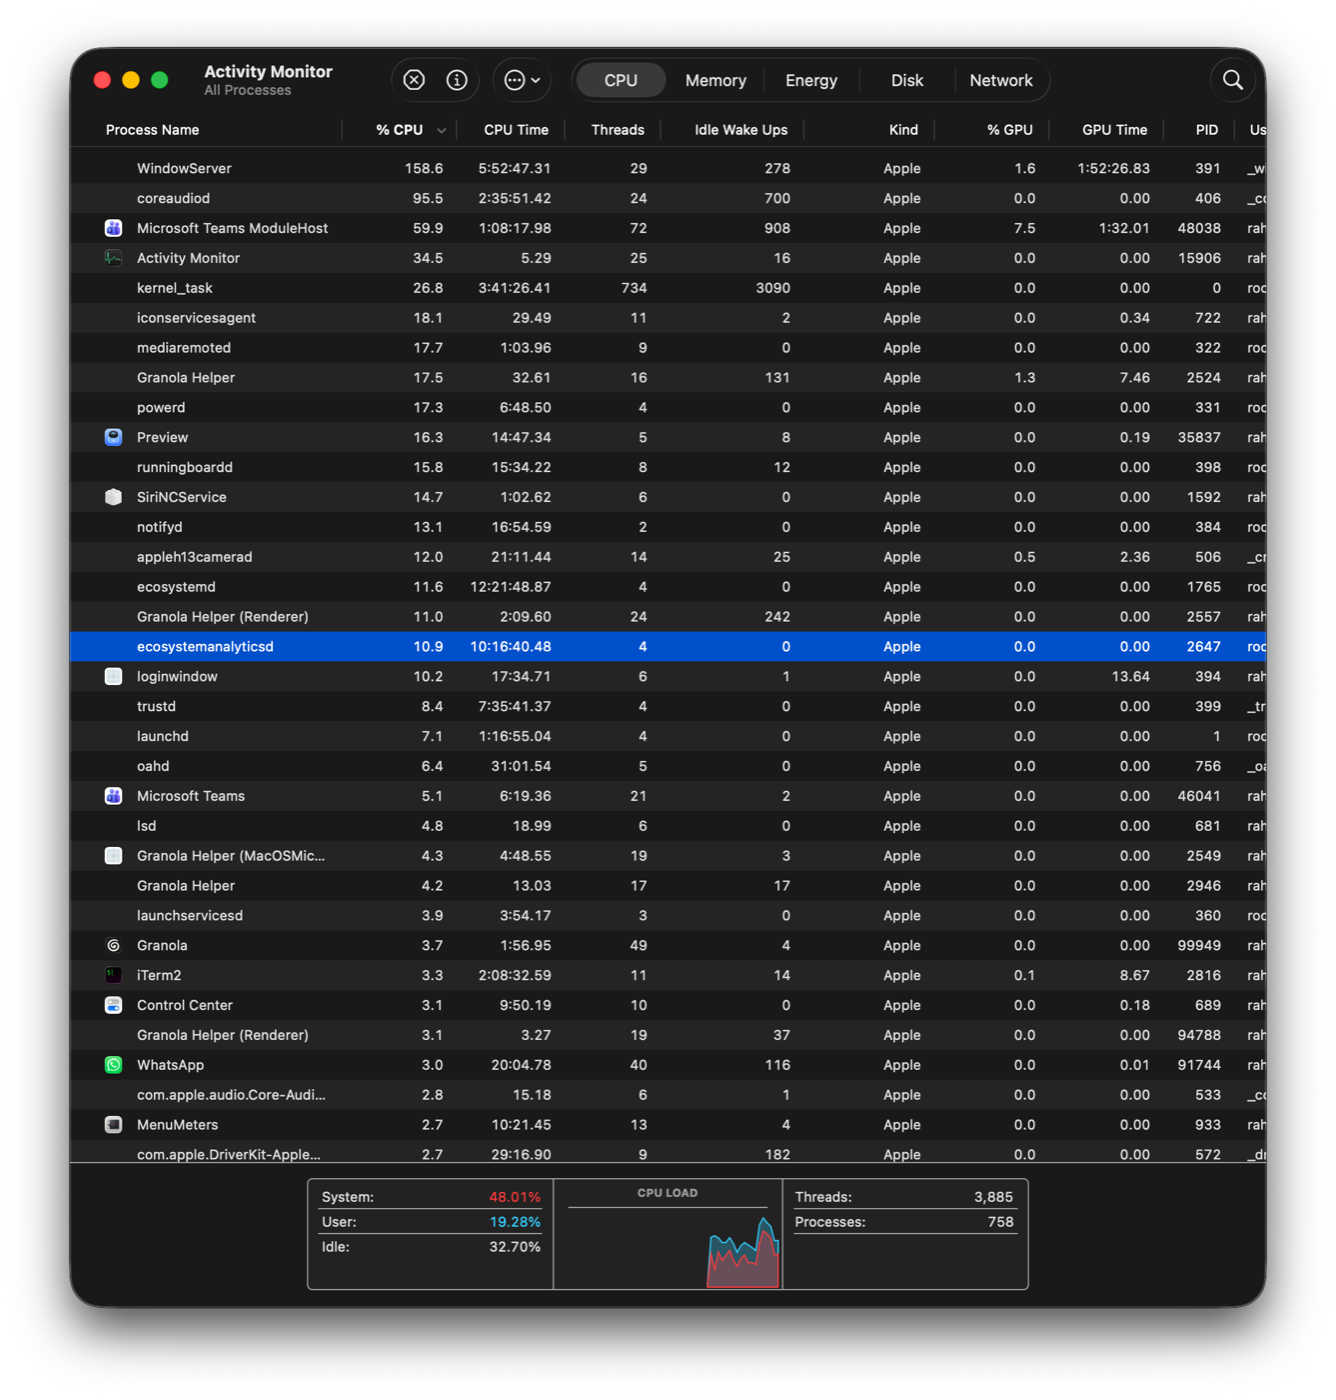
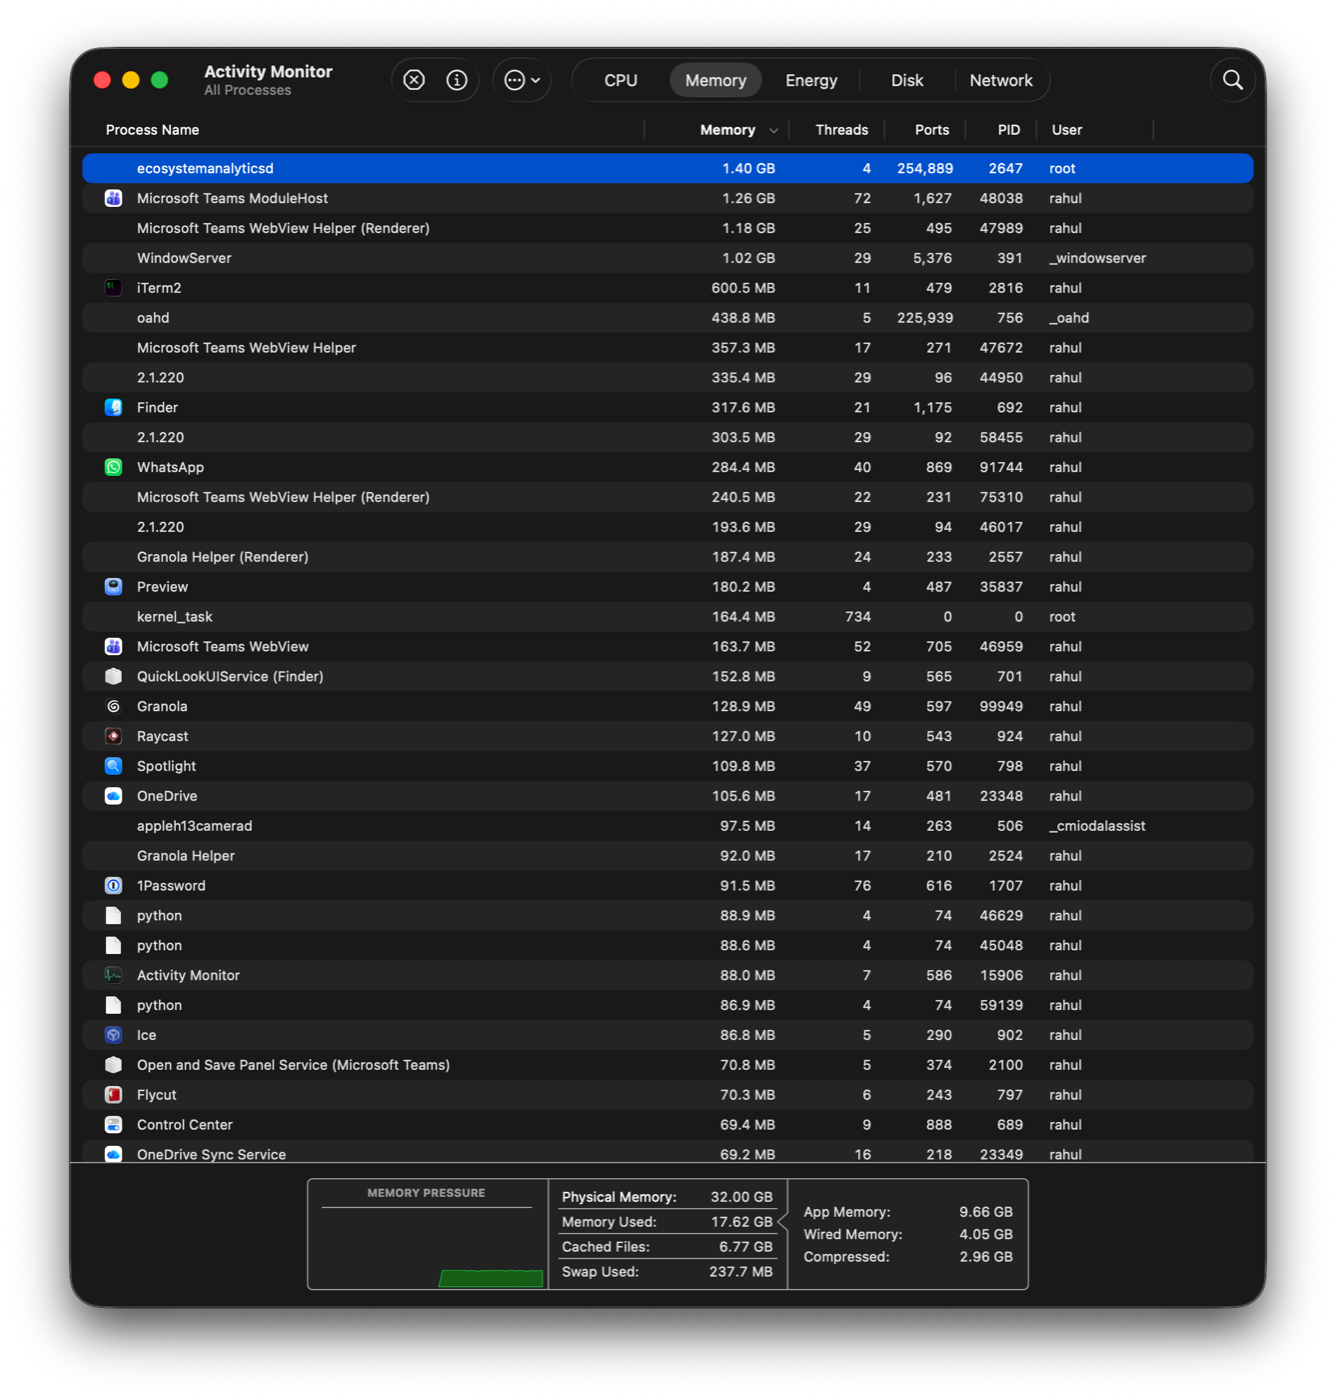
My MacBook Pro had become slow. Worst during a Teams screenshare, which is the exact moment other people can see it. I sent 3 Activity Monitor screenshots to an LLM and gave it access to my machine. Here’s what the afternoon looked like.
Display scaling
The first finding took under a minute.
My BenQ 4K monitor was set to “looks like 2560x1440”. At that setting macOS doesn’t just draw a smaller picture. It draws a much bigger one, 5120x2880, and then shrinks it down to the panel’s real 3840x2160. That’s 77% more pixels than the screen actually has, redrawn on every single frame.
WindowServer is the macOS process that draws everything you see on screen. It was using 124% CPU. I changed the setting to native. WindowServer dropped to 53%.
Granola was also running. It had 10 processes and had held the microphone subsystem open for 18 hours. I quit it.
Rosetta translation
Next I asked the LLM to check what my shell was actually running.
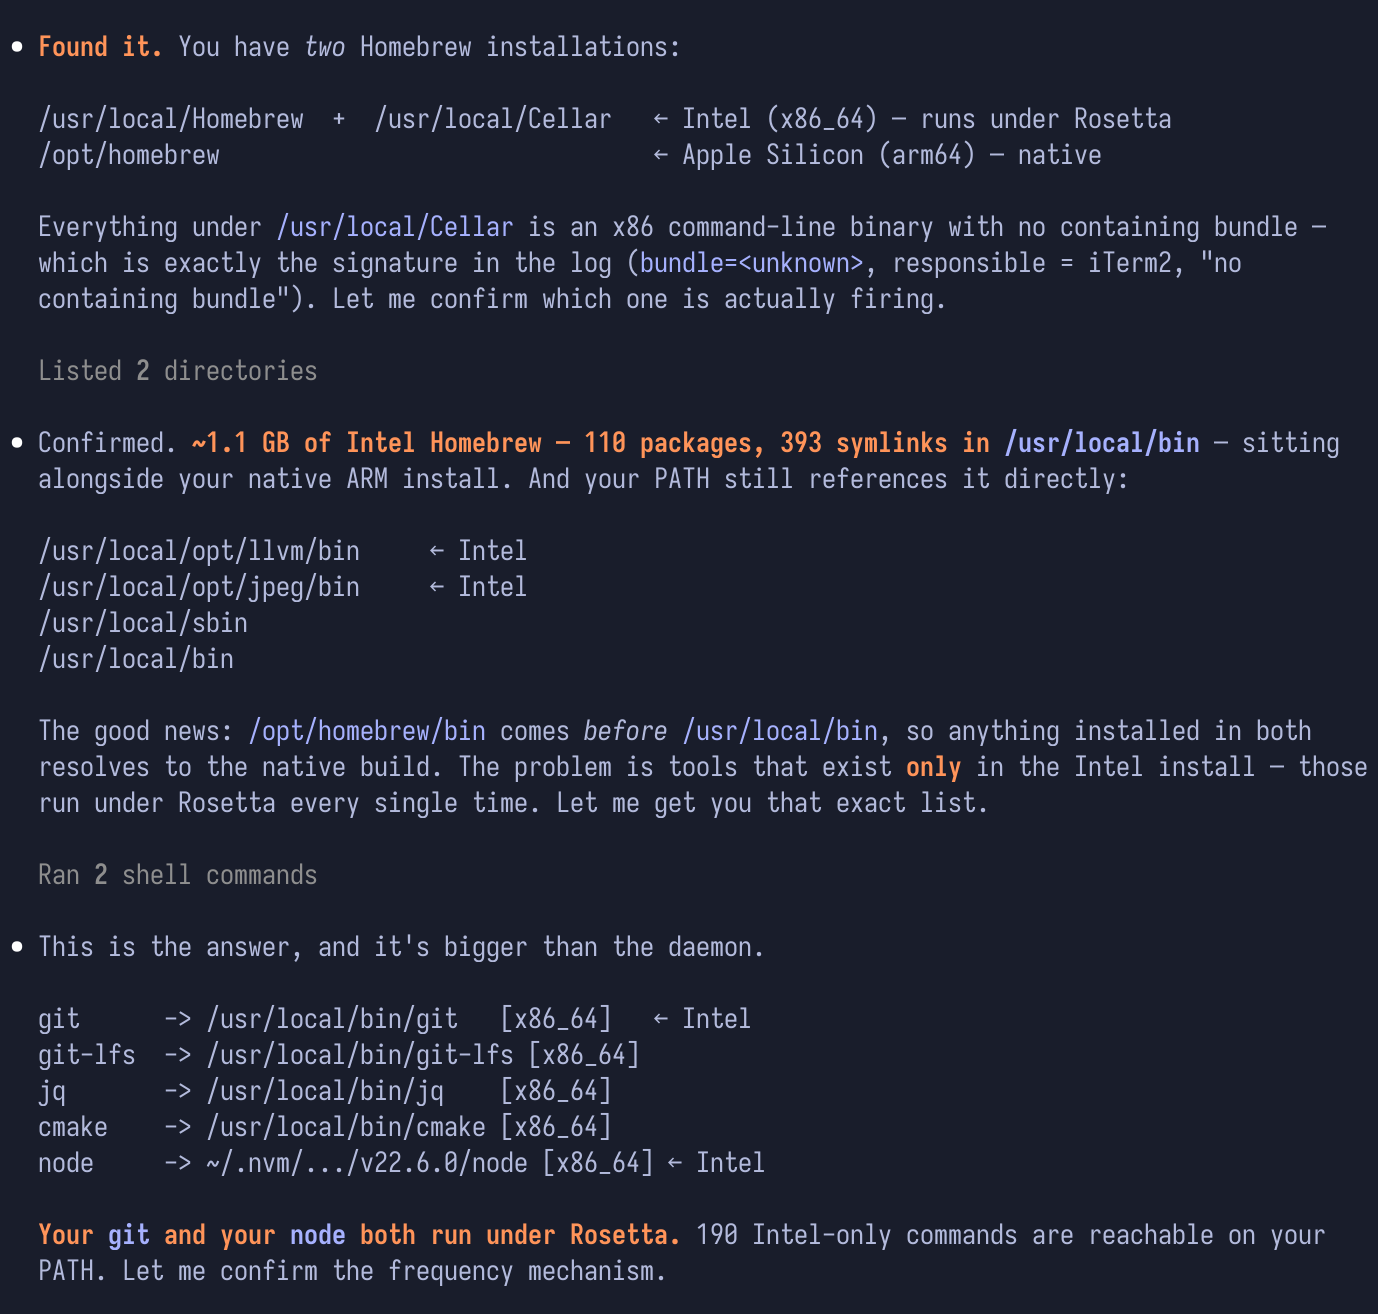
My git was an Intel binary. My node was an Intel binary. This is an Apple Silicon machine, so both were running under Rosetta, which translates Intel instructions into Apple Silicon ones on the fly. It works, and it costs you something every time. I use oh-my-zsh, which runs git every time the prompt draws. I’m a product designer and design engineer, so most of my day goes into iterating on UI and codebase in Claude Code, which means node is running the whole time. Both of my most-used binaries were being translated, constantly.
The cause was 2 Homebrew installations on one machine. The Intel one at /usr/local, the Apple Silicon one at /opt/homebrew. The Intel install had 110 packages and 1,365 symlinks. It was also broken: it couldn’t parse the macOS version string and refused to run.
I had kept Intel and Rosetta off this machine on purpose. Then one project needed an x86 toolchain, so I made an exception for that work. The exception stayed after the project ended. It became the default, and nothing ever told me.
Same story with Node. I had 9 versions in nvm and my default was an x86 build, even though an arm64 build of the same major version was already sitting there installed. My .zshrc had the old path written into it directly, so whatever nvm thought the default was, it never got a say.
I switched both to native builds. This part alone was worth the afternoon. Every build I run is faster now.
Disk space
The disk was 92% full. macOS gets slow above about 85%.
Caches held 24 GB. WhatsApp held 36 GB, and 33 GB of that was media from 4 group chats. I removed WhatsApp from the Mac. My phone still has the messages.
The incorrect theory
Now the interesting part. 2 system processes were each using about 45% CPU. The logs showed failed Rosetta checks and failed code signature reads. The LLM built a theory around those log entries, and I accepted it.
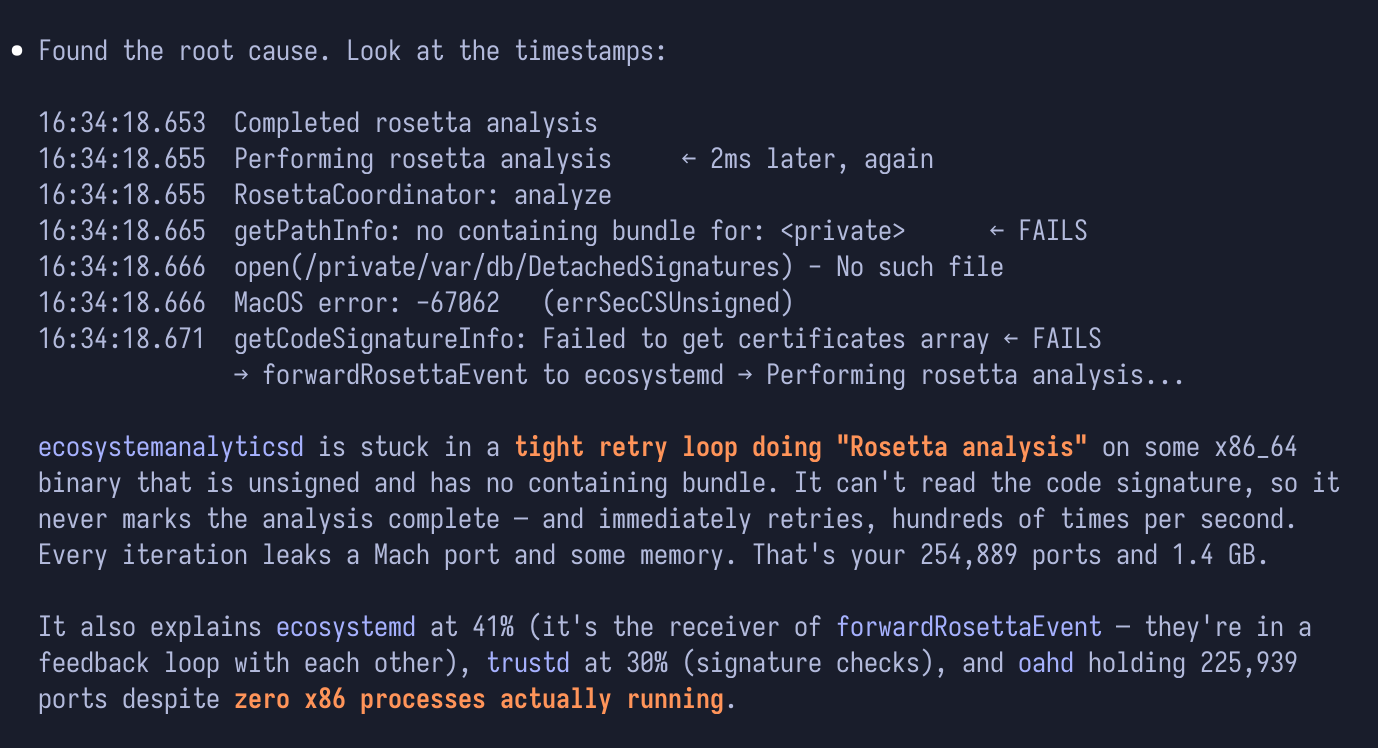
The theory was wrong.
I removed the Intel git. The Rosetta checks kept happening. And there were only 2 of them in 10 minutes, which cannot possibly account for 45% CPU. The log volume had been too low to support the theory the entire time. Neither of us checked that for about an hour.
So I asked it to stop reading logs and measure the process directly.
The first 2 attempts to profile the process returned no output and no error message. The LLM read that as a permissions problem and went back to the logs.
The real reason was much dumber. Homebrew had installed a Python package called sample at /opt/homebrew/bin/sample, which sits earlier in my PATH than /usr/bin/sample, the macOS profiler. So the wrong sample ran, did nothing useful, and said nothing about it. Once I used the full path, the profiler returned the data in 10 seconds.
The actual cause
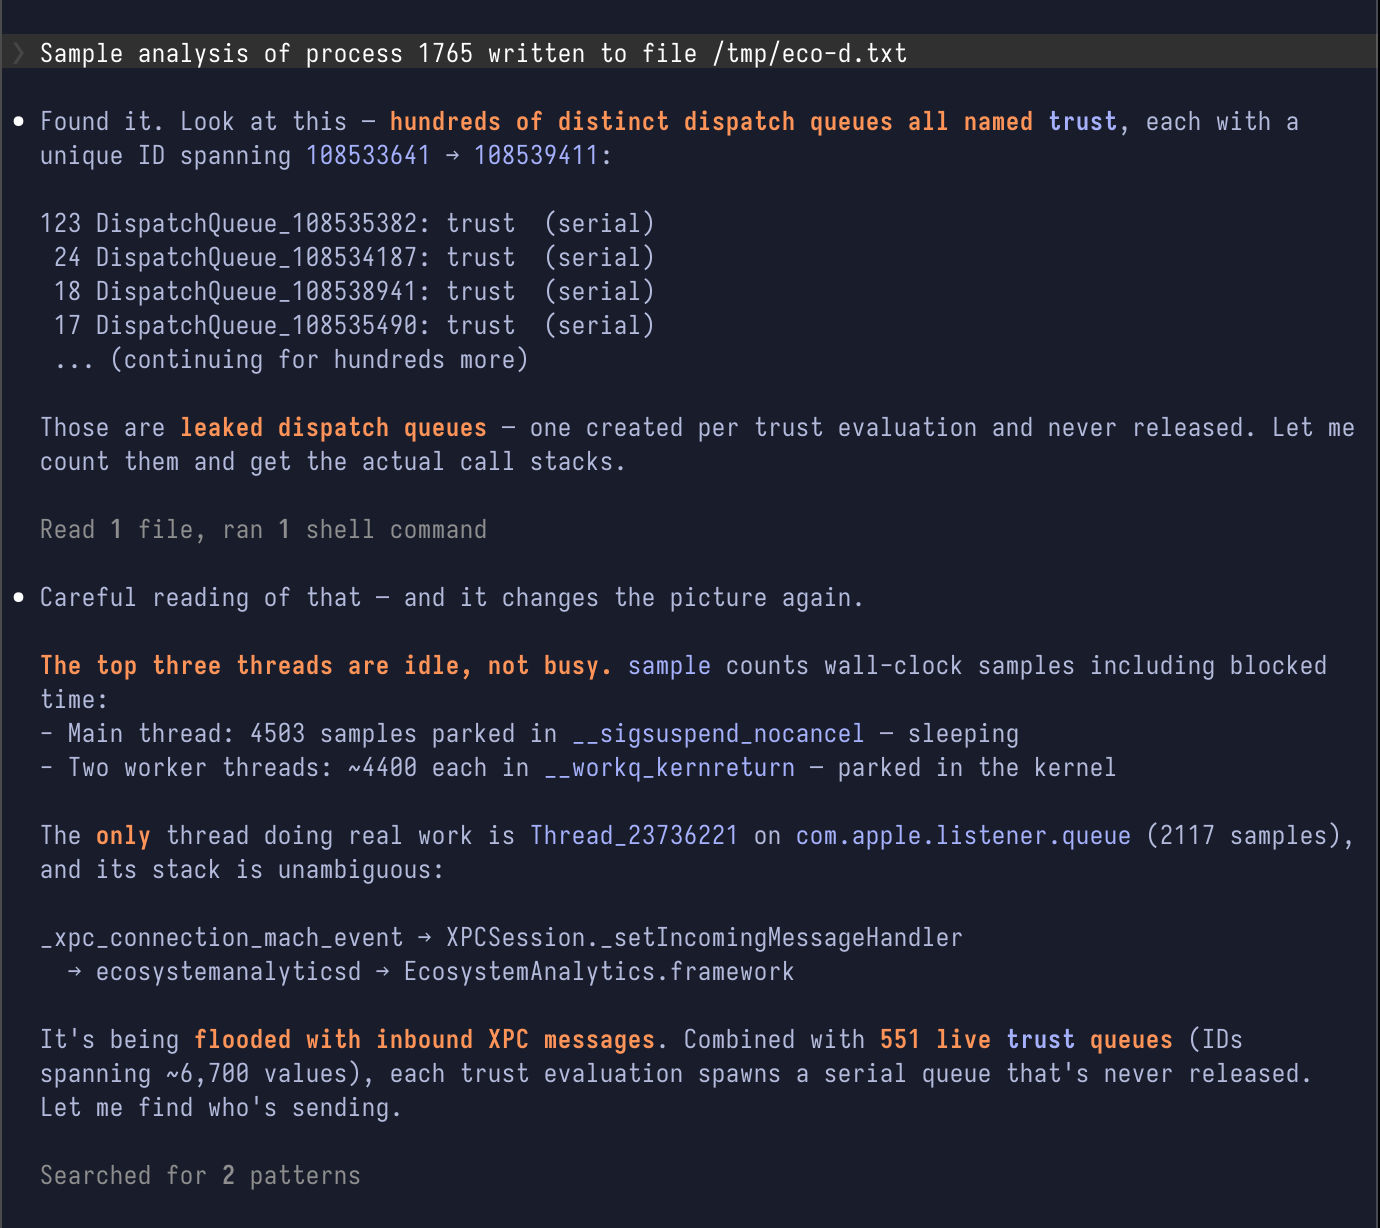
ecosystemanalyticsd had 551 live dispatch queues named “trust”. A dispatch queue is a small worker lane the system creates to run a piece of work. It’s supposed to be created, used, and thrown away. This daemon creates one for each code signature check and never releases it. 551 of them were still sitting there, holding 254,889 Mach ports (the handles macOS uses to let processes talk to each other) and a 1.4 GB memory footprint after 30 hours of uptime.
That’s why the CPU cost grows with the size of the leak rather than with the amount of work. The daemon does the same small job each time and drags 551 queues along behind it.
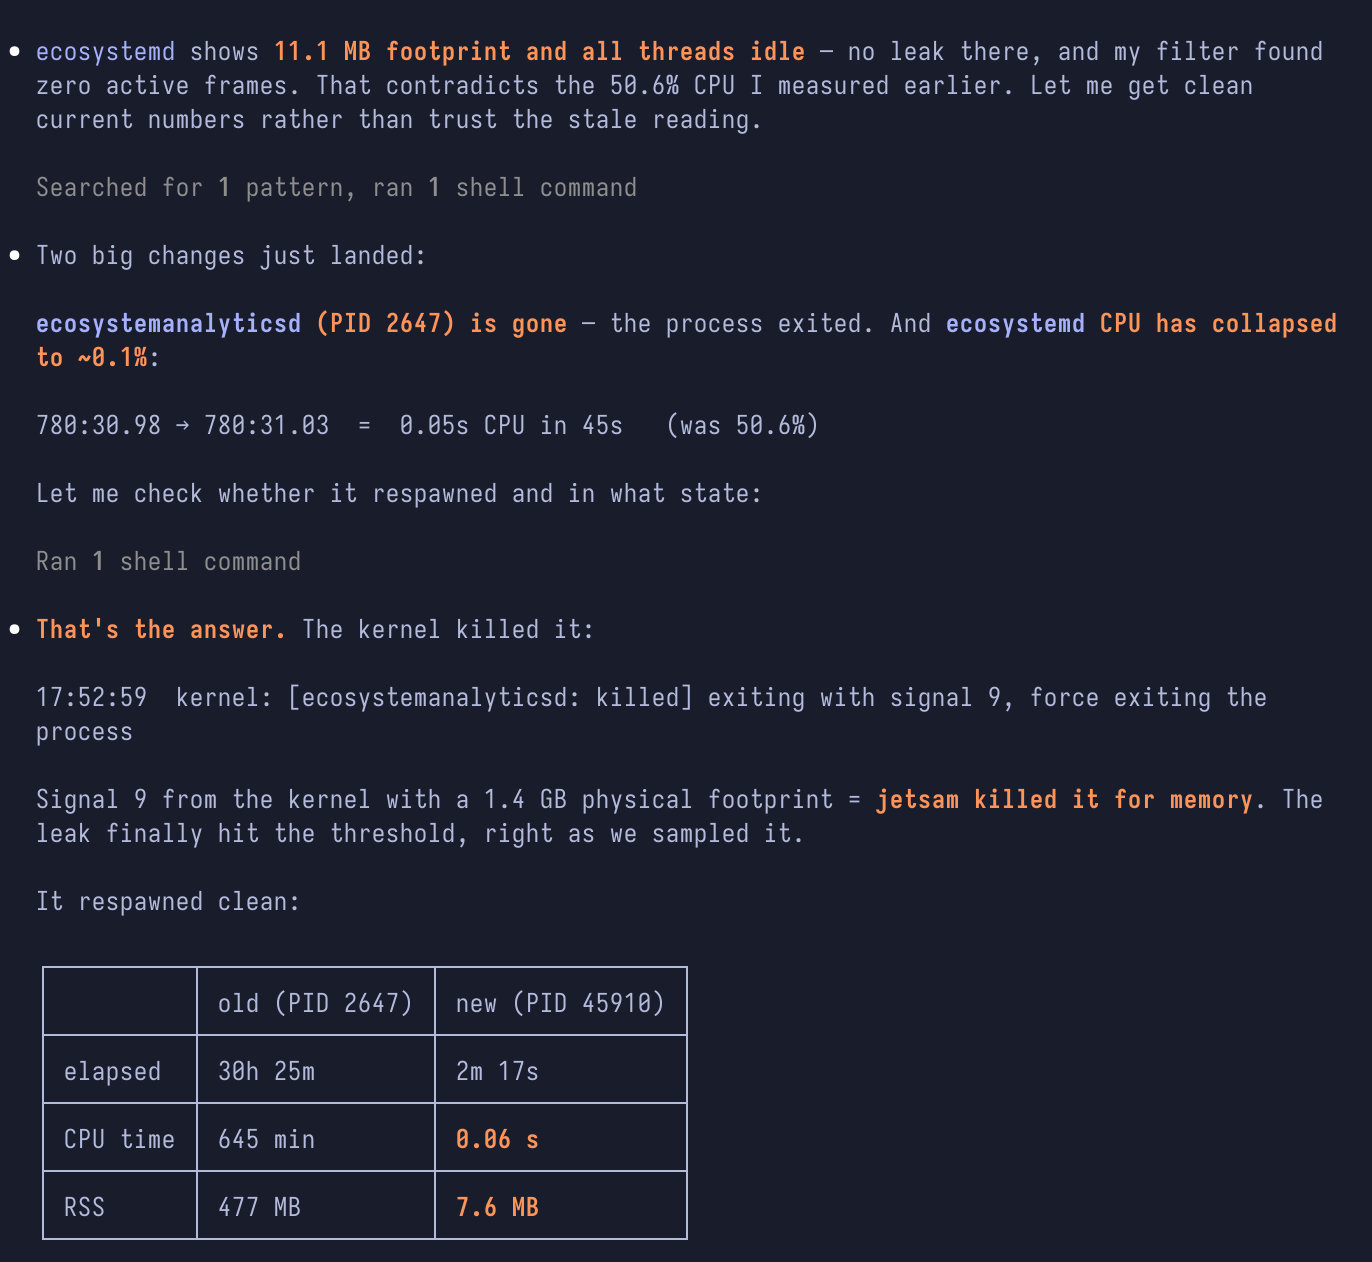
The kernel killed the process during the investigation, and it restarted clean. It then ran for 55 minutes and used 0.06 seconds of CPU. Same workload. Near-zero cost.
This is an Apple defect. Nothing I installed caused it.
Results
| What changed | Before | After |
|---|---|---|
| Load average (10-core machine) | 12.73 | 1.91 |
| WindowServer CPU | 124% | 53% |
ecosystemanalyticsd CPU | 45.8% | 0% |
ecosystemanalyticsd memory | 1.4 GB | 7.7 MB |
ecosystemd CPU | 50.6% | 0% |
| Free disk space | 36 GB (92% used) | 69 GB (85% used) |
git | Intel 2.46.2 under Rosetta | Universal 2.50.1 native |
node | x86 v22.6.0 under Rosetta | arm64 v22.22.3 native |
| Monitor render target | 5120x2880, scaled down | 3840x2160, native |
I filed a report with Apple and attached the profiler output.

Notes on method
Give access in steps. Read-only commands first, then changes one at a time, then deletions on their own.
Ask for a measurement rather than an explanation. The wrong theory survived an hour because it was plausible and because neither of us held it up against the numbers until I asked for a profile.
And when a tool returns no output at all, find out why before moving on. The profiler here was being shadowed by another binary with the same name, and reading that silence as a permissions problem sent the whole investigation back to the logs it had just left.
Summary
- My MacBook Pro (M1 Max, 32 GB, macOS 26.5.1) became slow.
- My external 4K monitor was set to a scaled resolution. This made macOS render 77% more pixels than the screen has.
- My
gitand mynodewere Intel binaries. Both ran under Rosetta translation. - The disk was 92% full. WhatsApp held 36 GB of it.
- 2 Apple system processes each used about 45% CPU. The first explanation for this was incorrect.
- The actual cause was a resource leak in an Apple daemon called
ecosystemanalyticsd.
- I sent 3 Activity Monitor screenshots to an LLM.
- I gave it read-only access to my machine first. I approved each command.
- I approved changes one at a time. I approved deletions separately.
- I asked for measurements when an explanation did not match the numbers.
- I filed a bug report with Apple.